Can Flexidynamic Holdings Berhad's (KLSE:FLEXI) Weak Financials Pull The Plug On The Stock's Current Momentum On Its Share Price?
Flexidynamic Holdings Berhad's (KLSE:FLEXI) stock is up by a considerable 25% over the past month. We, however wanted to have a closer look at its key financial indicators as the markets usually pay for long-term fundamentals, and in this case, they don't look very promising. Specifically, we decided to study Flexidynamic Holdings Berhad's ROE in this article.
Return on equity or ROE is a key measure used to assess how efficiently a company's management is utilizing the company's capital. In other words, it is a profitability ratio which measures the rate of return on the capital provided by the company's shareholders.
See our latest analysis for Flexidynamic Holdings Berhad
How Is ROE Calculated?
Return on equity can be calculated by using the formula:
Return on Equity = Net Profit (from continuing operations) ÷ Shareholders' Equity
So, based on the above formula, the ROE for Flexidynamic Holdings Berhad is:
1.0% = RM378k ÷ RM38m (Based on the trailing twelve months to December 2023).
The 'return' is the profit over the last twelve months. One way to conceptualize this is that for each MYR1 of shareholders' capital it has, the company made MYR0.01 in profit.
Why Is ROE Important For Earnings Growth?
So far, we've learned that ROE is a measure of a company's profitability. Depending on how much of these profits the company reinvests or "retains", and how effectively it does so, we are then able to assess a company’s earnings growth potential. Generally speaking, other things being equal, firms with a high return on equity and profit retention, have a higher growth rate than firms that don’t share these attributes.
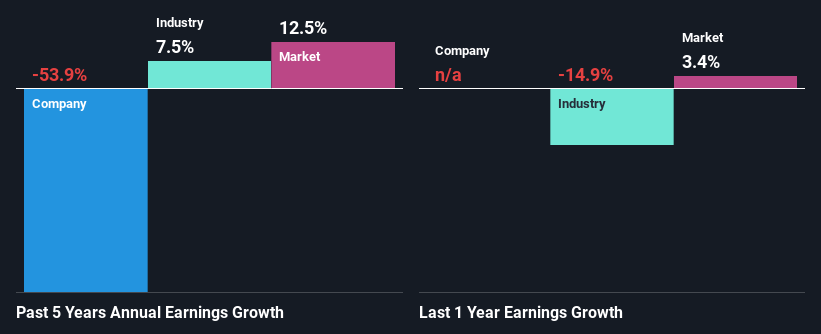
A Side By Side comparison of Flexidynamic Holdings Berhad's Earnings Growth And 1.0% ROE
As you can see, Flexidynamic Holdings Berhad's ROE looks pretty weak. Not just that, even compared to the industry average of 8.4%, the company's ROE is entirely unremarkable. For this reason, Flexidynamic Holdings Berhad's five year net income decline of 54% is not surprising given its lower ROE. We believe that there also might be other aspects that are negatively influencing the company's earnings prospects. For instance, the company has a very high payout ratio, or is faced with competitive pressures.
However, when we compared Flexidynamic Holdings Berhad's growth with the industry we found that while the company's earnings have been shrinking, the industry has seen an earnings growth of 7.5% in the same period. This is quite worrisome.
Earnings growth is a huge factor in stock valuation. What investors need to determine next is if the expected earnings growth, or the lack of it, is already built into the share price. By doing so, they will have an idea if the stock is headed into clear blue waters or if swampy waters await. One good indicator of expected earnings growth is the P/E ratio which determines the price the market is willing to pay for a stock based on its earnings prospects. So, you may want to check if Flexidynamic Holdings Berhad is trading on a high P/E or a low P/E, relative to its industry.
Is Flexidynamic Holdings Berhad Making Efficient Use Of Its Profits?
With a high three-year median payout ratio of 72% (implying that 28% of the profits are retained), most of Flexidynamic Holdings Berhad's profits are being paid to shareholders, which explains the company's shrinking earnings. With only a little being reinvested into the business, earnings growth would obviously be low or non-existent. You can see the 5 risks we have identified for Flexidynamic Holdings Berhad by visiting our risks dashboard for free on our platform here.
In addition, Flexidynamic Holdings Berhad only recently started paying a dividend so the management probably decided the shareholders prefer dividends even though earnings have been shrinking.
Conclusion
On the whole, Flexidynamic Holdings Berhad's performance is quite a big let-down. The company has seen a lack of earnings growth as a result of retaining very little profits and whatever little it does retain, is being reinvested at a very low rate of return. So far, we've only made a quick discussion around the company's earnings growth. So it may be worth checking this free detailed graph of Flexidynamic Holdings Berhad's past earnings, as well as revenue and cash flows to get a deeper insight into the company's performance.
Have feedback on this article? Concerned about the content? Get in touch with us directly. Alternatively, email editorial-team (at) simplywallst.com.
This article by Simply Wall St is general in nature. We provide commentary based on historical data and analyst forecasts only using an unbiased methodology and our articles are not intended to be financial advice. It does not constitute a recommendation to buy or sell any stock, and does not take account of your objectives, or your financial situation. We aim to bring you long-term focused analysis driven by fundamental data. Note that our analysis may not factor in the latest price-sensitive company announcements or qualitative material. Simply Wall St has no position in any stocks mentioned.
