
Declining Stock and Decent Financials: Is The Market Wrong About Zhejiang Xinan Chemical Industrial Group Co.,Ltd (SHSE:600596)?
Declining Stock and Decent Financials: Is The Market Wrong About Zhejiang Xinan Chemical Industrial Group Co.,Ltd (SHSE:600596)?
Zhejiang Xinan Chemical Industrial GroupLtd (SHSE:600596) has had a rough three months with its share price down 9.5%. However, stock prices are usually driven by a company's financials over the long term, which in this case look pretty respectable. Particularly, we will be paying attention to Zhejiang Xinan Chemical Industrial GroupLtd's ROE today.
浙江新安化工集團有限公司(上海證券交易所代碼:600596)經歷了艱難的三個月,其股價下跌了9.5%。但是,從長遠來看,股票價格通常由公司的財務狀況驅動,在這種情況下,這看起來相當可觀。特別是,我們今天將關注浙江新安化工集團有限公司的投資回報率。
Return on equity or ROE is an important factor to be considered by a shareholder because it tells them how effectively their capital is being reinvested. In short, ROE shows the profit each dollar generates with respect to its shareholder investments.
股本回報率或投資回報率是股東需要考慮的重要因素,因爲它可以告訴他們資本再投資的有效性。簡而言之,投資回報率顯示了每美元從其股東投資中產生的利潤。
How Do You Calculate Return On Equity?
你如何計算股本回報率?
The formula for return on equity is:
股本回報率的公式是:
Return on Equity = Net Profit (from continuing operations) ÷ Shareholders' Equity
股本回報率 = 淨利潤(來自持續經營業務)÷ 股東權益
So, based on the above formula, the ROE for Zhejiang Xinan Chemical Industrial GroupLtd is:
因此,根據上述公式,浙江新安化工集團有限公司的投資回報率爲:
2.6% = CN¥311m ÷ CN¥12b (Based on the trailing twelve months to September 2023).
2.6% = 3.11億元人民幣 ¥12b(基於截至2023年9月的過去十二個月)。
The 'return' is the profit over the last twelve months. That means that for every CN¥1 worth of shareholders' equity, the company generated CN¥0.03 in profit.
“回報” 是過去十二個月的利潤。這意味着,公司每獲得價值1元人民幣的股東權益,就會產生0.03CN的利潤。
What Has ROE Got To Do With Earnings Growth?
投資回報率與收益增長有什麼關係?
So far, we've learned that ROE is a measure of a company's profitability. Based on how much of its profits the company chooses to reinvest or "retain", we are then able to evaluate a company's future ability to generate profits. Generally speaking, other things being equal, firms with a high return on equity and profit retention, have a higher growth rate than firms that don't share these attributes.
到目前爲止,我們已經了解到,投資回報率是衡量公司盈利能力的指標。根據公司選擇將多少利潤進行再投資或 “保留”,我們便能夠評估公司未來創造利潤的能力。一般而言,在其他條件相同的情況下,股本回報率和利潤留存率高的公司的增長率要高於不具有這些屬性的公司。
Zhejiang Xinan Chemical Industrial GroupLtd's Earnings Growth And 2.6% ROE
浙江新安化工集團有限公司的收益增長和2.6%的投資回報率
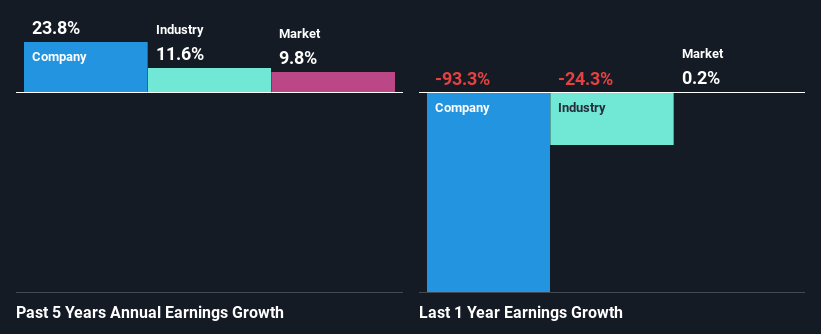
It is quite clear that Zhejiang Xinan Chemical Industrial GroupLtd's ROE is rather low. Even when compared to the industry average of 7.1%, the ROE figure is pretty disappointing. In spite of this, Zhejiang Xinan Chemical Industrial GroupLtd was able to grow its net income considerably, at a rate of 24% in the last five years. We reckon that there could be other factors at play here. Such as - high earnings retention or an efficient management in place.
很明顯,浙江新安化工集團有限公司的投資回報率相當低。即使與7.1%的行業平均水平相比,投資回報率的數字也相當令人失望。儘管如此,浙江新安化工集團有限公司的淨收入仍大幅增長,在過去五年中增長了24%。我們認爲這裏可能還有其他因素在起作用。例如——高收益留存率或實行高效管理。
Next, on comparing with the industry net income growth, we found that Zhejiang Xinan Chemical Industrial GroupLtd's growth is quite high when compared to the industry average growth of 12% in the same period, which is great to see.
接下來,與行業淨收入增長相比,我們發現,與同期行業平均增長12%相比,浙江新安化工集團有限公司的增長相當高,這真是太好了。
Earnings growth is an important metric to consider when valuing a stock. It's important for an investor to know whether the market has priced in the company's expected earnings growth (or decline). By doing so, they will have an idea if the stock is headed into clear blue waters or if swampy waters await. If you're wondering about Zhejiang Xinan Chemical Industrial GroupLtd's's valuation, check out this gauge of its price-to-earnings ratio, as compared to its industry.
收益增長是對股票進行估值時要考慮的重要指標。對於投資者來說,重要的是要知道市場是否對公司的預期收益增長(或下降)進行了定價。通過這樣做,他們將知道股票是走向清澈的藍色海水,還是沼澤的水域在等着你。如果你想知道浙江新安化工集團有限公司的估值,可以看看這個衡量其與行業相比的市盈率指標。
Is Zhejiang Xinan Chemical Industrial GroupLtd Making Efficient Use Of Its Profits?
浙江新安化工集團有限公司是否在有效利用其利潤?
Zhejiang Xinan Chemical Industrial GroupLtd's three-year median payout ratio to shareholders is 23%, which is quite low. This implies that the company is retaining 77% of its profits. This suggests that the management is reinvesting most of the profits to grow the business as evidenced by the growth seen by the company.
浙江新安化工集團有限公司的三年股東派息率中位數爲23%,相當低。這意味着該公司保留了77%的利潤。這表明管理層正在將大部分利潤再投資於業務增長,公司的增長就證明了這一點。
Besides, Zhejiang Xinan Chemical Industrial GroupLtd has been paying dividends for at least ten years or more. This shows that the company is committed to sharing profits with its shareholders.
此外,浙江新安化工集團有限公司已經派發了至少十年或更長時間的股息。這表明該公司致力於與股東分享利潤。
Summary
摘要
Overall, we feel that Zhejiang Xinan Chemical Industrial GroupLtd certainly does have some positive factors to consider. Despite its low rate of return, the fact that the company reinvests a very high portion of its profits into its business, no doubt contributed to its high earnings growth. With that said, the latest industry analyst forecasts reveal that the company's earnings are expected to accelerate. To know more about the latest analysts predictions for the company, check out this visualization of analyst forecasts for the company.
總體而言,我們認爲浙江新安化工集團有限公司確實有一些積極因素需要考慮。儘管回報率很低,但該公司將其利潤的很大一部分再投資於業務這一事實無疑促進了其高收益增長。話雖如此,最新的行業分析師預測顯示,該公司的收益有望加速。要詳細了解分析師對公司的最新預測,請查看該公司的分析師預測的可視化。
Have feedback on this article? Concerned about the content? Get in touch with us directly. Alternatively, email editorial-team (at) simplywallst.com.
This article by Simply Wall St is general in nature. We provide commentary based on historical data and analyst forecasts only using an unbiased methodology and our articles are not intended to be financial advice. It does not constitute a recommendation to buy or sell any stock, and does not take account of your objectives, or your financial situation. We aim to bring you long-term focused analysis driven by fundamental data. Note that our analysis may not factor in the latest price-sensitive company announcements or qualitative material. Simply Wall St has no position in any stocks mentioned.
對這篇文章有反饋嗎?對內容感到擔憂?直接聯繫我們。 或者,給編輯團隊 (at) simplywallst.com 發送電子郵件。
Simply Wall St的這篇文章本質上是籠統的。我們僅使用公正的方法根據歷史數據和分析師的預測提供評論,我們的文章無意作爲財務建議。它不構成買入或賣出任何股票的建議,也沒有考慮到您的目標或財務狀況。我們的目標是爲您提供由基本數據驅動的長期重點分析。請注意,我們的分析可能不考慮最新的價格敏感型公司公告或定性材料。簡而言之,華爾街沒有持有任何上述股票的頭寸。
譯文內容由第三人軟體翻譯。