
Pacific Radiance Ltd. (SGX:RXS) shares have had a really impressive month, gaining 30% after a shaky period beforehand. Unfortunately, the gains of the last month did little to right the losses of the last year with the stock still down 33% over that time.
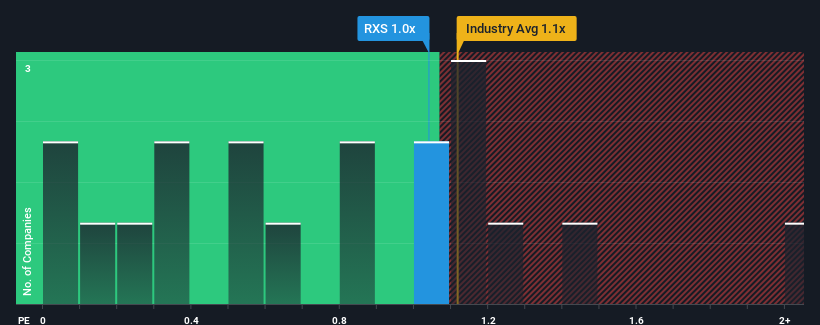
In spite of the firm bounce in price, there still wouldn't be many who think Pacific Radiance's price-to-sales (or "P/S") ratio of 1x is worth a mention when the median P/S in Singapore's Energy Services industry is similar at about 0.9x. Although, it's not wise to simply ignore the P/S without explanation as investors may be disregarding a distinct opportunity or a costly mistake.
What Does Pacific Radiance's P/S Mean For Shareholders?
The recent revenue growth at Pacific Radiance would have to be considered satisfactory if not spectacular. It might be that many expect the respectable revenue performance to only match most other companies over the coming period, which has kept the P/S from rising. Those who are bullish on Pacific Radiance will be hoping that this isn't the case, so that they can pick up the stock at a lower valuation.
Although there are no analyst estimates available for Pacific Radiance, take a look at this free data-rich visualisation to see how the company stacks up on earnings, revenue and cash flow.Do Revenue Forecasts Match The P/S Ratio?
Pacific Radiance's P/S ratio would be typical for a company that's only expected to deliver moderate growth, and importantly, perform in line with the industry.
If we review the last year of revenue growth, the company posted a worthy increase of 5.1%. The latest three year period has also seen an excellent 252% overall rise in revenue, aided somewhat by its short-term performance. Accordingly, shareholders would have definitely welcomed those medium-term rates of revenue growth.
When compared to the industry's one-year growth forecast of 17%, the most recent medium-term revenue trajectory is noticeably more alluring
In light of this, it's curious that Pacific Radiance's P/S sits in line with the majority of other companies. It may be that most investors are not convinced the company can maintain its recent growth rates.
What We Can Learn From Pacific Radiance's P/S?
Pacific Radiance's stock has a lot of momentum behind it lately, which has brought its P/S level with the rest of the industry. Using the price-to-sales ratio alone to determine if you should sell your stock isn't sensible, however it can be a practical guide to the company's future prospects.
To our surprise, Pacific Radiance revealed its three-year revenue trends aren't contributing to its P/S as much as we would have predicted, given they look better than current industry expectations. It'd be fair to assume that potential risks the company faces could be the contributing factor to the lower than expected P/S. At least the risk of a price drop looks to be subdued if recent medium-term revenue trends continue, but investors seem to think future revenue could see some volatility.
You need to take note of risks, for example - Pacific Radiance has 5 warning signs (and 2 which are a bit concerning) we think you should know about.
If strong companies turning a profit tickle your fancy, then you'll want to check out this free list of interesting companies that trade on a low P/E (but have proven they can grow earnings).
Have feedback on this article? Concerned about the content? Get in touch with us directly. Alternatively, email editorial-team (at) simplywallst.com.
This article by Simply Wall St is general in nature. We provide commentary based on historical data and analyst forecasts only using an unbiased methodology and our articles are not intended to be financial advice. It does not constitute a recommendation to buy or sell any stock, and does not take account of your objectives, or your financial situation. We aim to bring you long-term focused analysis driven by fundamental data. Note that our analysis may not factor in the latest price-sensitive company announcements or qualitative material. Simply Wall St has no position in any stocks mentioned.