
Tesla Stalls, Dramatically Lags Magnificent Seven Peers But Divergence Has Developed: A Technical Analysis
Tesla Stalls, Dramatically Lags Magnificent Seven Peers But Divergence Has Developed: A Technical Analysis
Tesla, Inc (NASDAQ:TSLA) was trading mostly flat Friday, continuing to trade mostly sideways within a triangle formation on the daily chart.
特斯拉公司(納斯達克股票代碼:TSLA)週五的交易基本持平,在日線圖上繼續以三角形的形式進行橫盤整理。
Unlike NVIDIA Corporation, which has surged about 57% since the first trading day of 2024, Tesla has fallen about 22% and on Thursday, Jim Cramer said Nvidia CEO Jensen Huang is a "bigger visionary" than Elon Musk. Read More Here...
與自2024年第一個交易日以來飆升了約57%的英偉達公司不同,特斯拉下跌了約22%,吉姆·克萊默週四表示,英偉達首席執行官黃延森是比埃隆·馬斯克 “更有遠見的人”。 在這裏閱讀更多...
While Tesla's performance recently has severely lagged behind the six other Magnificent Seven stocks, a reversal has been taking place, which could set the EV giant on a larger rebound because the stock is trading in a triangle pattern and has developed hidden bullish divergence.
儘管特斯拉最近的表現嚴重落後於其他六隻壯觀的七隻股票,但正在發生逆轉,這可能會使這家電動汽車巨頭出現更大的反彈,因爲該股交易呈三角形模式,並出現了隱性看漲分歧。
For traders hoping to profit from a potential reversal to the upside in Tesla, single-stock ETFs could provide a solid return.
對於希望從特斯拉的潛在上行逆轉中獲利的交易者來說,個股ETF可以提供可觀的回報。
Read Next: Tesla's Model 3 Long-Range Gets Price Hike For Third Time This Month, But It's Teeny
繼續閱讀:特斯拉的Model 3長續航本月第三次漲價,但還很小
Trending: Market Optimism Drives Fidelity Manager To Sell Off Treasuries: 'We Don't Expect Sort Of A Recession Anymore'
趨勢:市場樂觀情緒促使富達經理拋售國債:“我們預計不會再出現衰退”
Single Stock ETFs: ETFs that only track one security are riskier than other leveraged or inverse funds because they don't offer diversification. Similar to leveraged index funds, single-stock ETFs should only be expected to track the underlying stock(s) for a single day.
個股ETF:僅跟蹤一種證券的ETF比其他槓桿或反向基金的風險更大,因爲它們不提供分散投資。與槓桿指數基金類似,個股ETF只能在一天內追蹤標的股票。
For traders who want to play Tesla bullishly, Direxion Daily TSLA Bull 1.5X Shares (NASDAQ:TSLL) offers 150% daily leveraged investment results to that of Tesla. For traders bearish on Tesla, Direxion Daily TSLA ear 1X Shares (NASDAQ:TSLS) seeks daily investment results, before fees and expenses, of 100% of the inverse (or opposite) of the performance of the EV giant.
對於想看漲特斯拉的交易者,Direxion Daily TSLA Bull 1.5X股票(納斯達克股票代碼:TSLL)提供的每日槓桿投資業績是特斯拉150%的每日槓桿投資業績。對於看跌特斯拉的交易者,《Direxion Daily TSLA ear 1X Shares》(納斯達克股票代碼:TSLS)尋求的每日投資業績爲這家電動汽車巨頭業績的倒數(或相反)的100%,扣除費用和開支。
It should be noted that leveraged and/or inverse ETFs are meant to be used as a trading vehicle as opposed to a long-term investment.
應該注意的是,槓桿和/或反向ETF旨在用作交易工具,而不是長期投資。
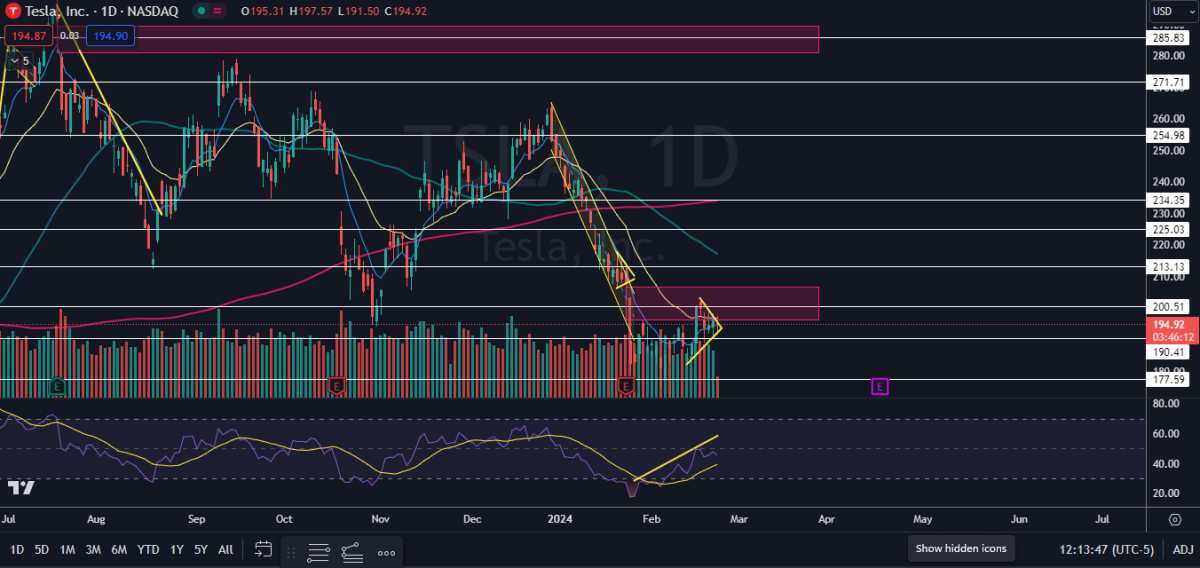
The Tesla Chart: Tesla has been trading in a triangle pattern since Feb. 16, making a series of higher lows and lower highs. While the stock has been consolidating within the triangle, bullish momentum has been increasing, which has caused hidden bullish divergence to form.
特斯拉走勢圖:自2月16日以來,特斯拉一直以三角形模式交易,創出一系列更高的低點和更低的高點。儘管該股一直在三角形內盤整,但看漲勢頭一直在增強,這導致了隱性看漲分歧的形成。
- For the divergence to correct, Tesla will either need to break up from the triangle into an uptrend or momentum will need to steadily decrease, causing the stock's relative strength index (RSI) to make a series of lower lows. Traders and investors can watch for the stock to break up or down from the triangle pattern on higher-than-average volume to indicate future direction.
- Tesla recently filled part of an upper gap that was left behind on Jan. 25 when the stock suffered a bearish reaction to its earnings print. A gap still exists between $203.17 and $206.77, which is likely to be filled in the future.
- Bullish traders want to see Tesla break up from the triangle and completely fill the upper gap. Bearish traders want to see the stock break down from the pattern on higher-than-average volume, which could throw Tesla into a new downtrend.
- Tesla has resistance above at $200.51 and at $213.13 and support below at $190.41 and at $177.59.
- 爲了糾正分歧,特斯拉要麼需要從三角形分解爲上升趨勢,要麼需要穩步減弱,從而導致該股的相對強度指數(RSI)跌至一系列較低的低點。交易者和投資者可以在交易量高於平均水平的情況下觀察股票從三角形模式上漲或下跌,以指明未來方向。
- 特斯拉最近填補了1月25日該股對業績的看跌反應時留下的部分上限缺口。203.17美元和206.77美元之間仍然存在差距,未來可能會填補這個缺口。
- 看漲的交易者希望看到特斯拉脫離三角形並完全填補上限缺口。看跌的交易者希望看到該股因交易量高於平均水平而擺脫這種模式,這可能會使特斯拉陷入新的下跌趨勢。
- 特斯拉的阻力位在200.51美元和213.13美元上方,支撐位低於190.41美元和177.59美元。
譯文內容由第三人軟體翻譯。