
 Yahoo Finance
 Progen Holdings (Catalist:583) Is Experiencing Growth In Returns On Capital
Did you know there are some financial metrics that can provide clues of a potential multi-bagger? Ideally, a business will show two trends; firstly a growing return on capital employed (ROCE) and secondly, an increasing amount of capital employed. This shows us that it's a compounding machine, able to continually reinvest its earnings back into the business and generate higher returns. With that in mind, we've noticed some promising trends at Progen Holdings (Catalist:583) so let's look a bit deeper.
Return On Capital Employed (ROCE): What Is It?
For those that aren't sure what ROCE is, it measures the amount of pre-tax profits a company can generate from the capital employed in its business. To calculate this metric for Progen Holdings, this is the formula:
Return on Capital Employed = Earnings Before Interest and Tax (EBIT) ÷ (Total Assets - Current Liabilities)
0.00021 = S$6.0k ÷ (S$33m - S$4.0m) (Based on the trailing twelve months to June 2023).
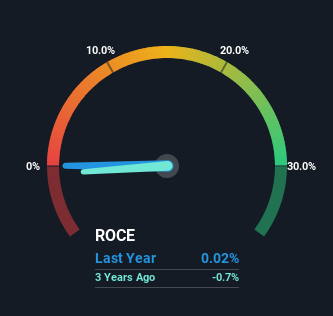
Therefore, Progen Holdings has an ROCE of 0.02%. Ultimately, that's a low return and it under-performs the Construction industry average of 3.6%.
See our latest analysis for Progen Holdings
While the past is not representative of the future, it can be helpful to know how a company has performed historically, which is why we have this chart above. If you're interested in investigating Progen Holdings' past further, check out this free graph of past earnings, revenue and cash flow.
How Are Returns Trending?
Progen Holdings has broken into the black (profitability) and we're sure it's a sight for sore eyes. While the business was unprofitable in the past, it's now turned things around and is earning 0.02% on its capital. While returns have increased, the amount of capital employed by Progen Holdings has remained flat over the period. So while we're happy that the business is more efficient, just keep in mind that could mean that going forward the business is lacking areas to invest internally for growth. After all, a company can only become a long term multi-bagger if it continually reinvests in itself at high rates of return.
The Key Takeaway
As discussed above, Progen Holdings appears to be getting more proficient at generating returns since capital employed has remained flat but earnings (before interest and tax) are up. Considering the stock has delivered 11% to its stockholders over the last five years, it may be fair to think that investors aren't fully aware of the promising trends yet. So exploring more about this stock could uncover a good opportunity, if the valuation and other metrics stack up.
On a separate note, we've found 4 warning signs for Progen Holdings you'll probably want to know about.
While Progen Holdings may not currently earn the highest returns, we've compiled a list of companies that currently earn more than 25% return on equity. Check out this free list here.
Have feedback on this article? Concerned about the content? Get in touch with us directly. Alternatively, email editorial-team (at) simplywallst.com.
This article by Simply Wall St is general in nature. We provide commentary based on historical data and analyst forecasts only using an unbiased methodology and our articles are not intended to be financial advice. It does not constitute a recommendation to buy or sell any stock, and does not take account of your objectives, or your financial situation. We aim to bring you long-term focused analysis driven by fundamental data. Note that our analysis may not factor in the latest price-sensitive company announcements or qualitative material. Simply Wall St has no position in any stocks mentioned.
