
 Yahoo Finance
 Excel Force MSC Berhad's (KLSE:EFORCE) Stock Has Seen Strong Momentum: Does That Call For Deeper Study Of Its Financial Prospects?
Most readers would already be aware that Excel Force MSC Berhad's (KLSE:EFORCE) stock increased significantly by 10% over the past week. As most would know, fundamentals are what usually guide market price movements over the long-term, so we decided to look at the company's key financial indicators today to determine if they have any role to play in the recent price movement. Specifically, we decided to study Excel Force MSC Berhad's ROE in this article.
Return on equity or ROE is an important factor to be considered by a shareholder because it tells them how effectively their capital is being reinvested. Put another way, it reveals the company's success at turning shareholder investments into profits.
View our latest analysis for Excel Force MSC Berhad
How Do You Calculate Return On Equity?
The formula for return on equity is:
Return on Equity = Net Profit (from continuing operations) ÷ Shareholders' Equity
So, based on the above formula, the ROE for Excel Force MSC Berhad is:
8.1% = RM7.9m ÷ RM97m (Based on the trailing twelve months to June 2023).
The 'return' is the yearly profit. So, this means that for every MYR1 of its shareholder's investments, the company generates a profit of MYR0.08.
What Is The Relationship Between ROE And Earnings Growth?
So far, we've learned that ROE is a measure of a company's profitability. Based on how much of its profits the company chooses to reinvest or "retain", we are then able to evaluate a company's future ability to generate profits. Assuming everything else remains unchanged, the higher the ROE and profit retention, the higher the growth rate of a company compared to companies that don't necessarily bear these characteristics.
A Side By Side comparison of Excel Force MSC Berhad's Earnings Growth And 8.1% ROE
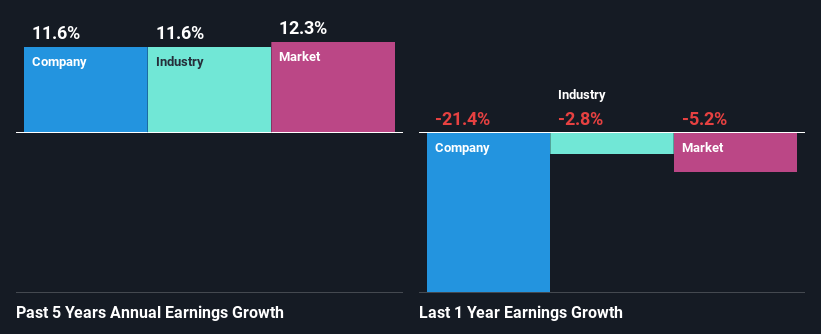
When you first look at it, Excel Force MSC Berhad's ROE doesn't look that attractive. Yet, a closer study shows that the company's ROE is similar to the industry average of 7.0%. Having said that, Excel Force MSC Berhad has shown a modest net income growth of 12% over the past five years. Taking into consideration that the ROE is not particularly high, we reckon that there could also be other factors at play which could be influencing the company's growth. For instance, the company has a low payout ratio or is being managed efficiently.
As a next step, we compared Excel Force MSC Berhad's net income growth with the industry and found that the company has a similar growth figure when compared with the industry average growth rate of 12% in the same period.
Earnings growth is a huge factor in stock valuation. What investors need to determine next is if the expected earnings growth, or the lack of it, is already built into the share price. By doing so, they will have an idea if the stock is headed into clear blue waters or if swampy waters await. Is Excel Force MSC Berhad fairly valued compared to other companies? These 3 valuation measures might help you decide.
Is Excel Force MSC Berhad Using Its Retained Earnings Effectively?
The high three-year median payout ratio of 64% (or a retention ratio of 36%) for Excel Force MSC Berhad suggests that the company's growth wasn't really hampered despite it returning most of its income to its shareholders.
Besides, Excel Force MSC Berhad has been paying dividends for at least ten years or more. This shows that the company is committed to sharing profits with its shareholders.
Summary
Overall, we feel that Excel Force MSC Berhad certainly does have some positive factors to consider. Namely, its high earnings growth. We do however feel that the earnings growth number could have been even higher, had the company been reinvesting more of its earnings and paid out less dividends. So far, we've only made a quick discussion around the company's earnings growth. So it may be worth checking this free detailed graph of Excel Force MSC Berhad's past earnings, as well as revenue and cash flows to get a deeper insight into the company's performance.
Have feedback on this article? Concerned about the content? Get in touch with us directly. Alternatively, email editorial-team (at) simplywallst.com.
This article by Simply Wall St is general in nature. We provide commentary based on historical data and analyst forecasts only using an unbiased methodology and our articles are not intended to be financial advice. It does not constitute a recommendation to buy or sell any stock, and does not take account of your objectives, or your financial situation. We aim to bring you long-term focused analysis driven by fundamental data. Note that our analysis may not factor in the latest price-sensitive company announcements or qualitative material. Simply Wall St has no position in any stocks mentioned.
