
 Yahoo Finance
 Improved Revenues Required Before AsiaMedic Limited (Catalist:505) Shares Find Their Feet
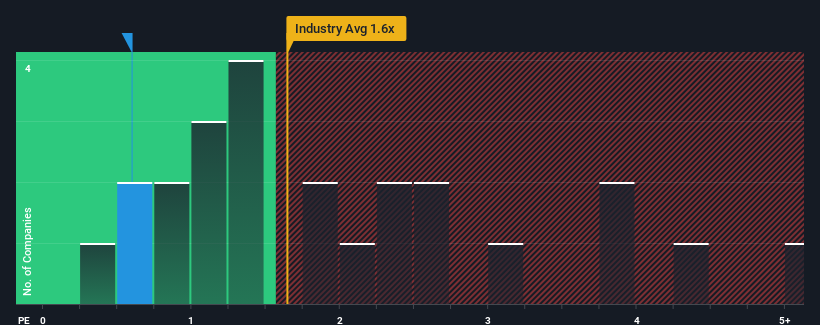
When you see that almost half of the companies in the Healthcare industry in Singapore have price-to-sales ratios (or "P/S") above 1.6x, AsiaMedic Limited (Catalist:505) looks to be giving off some buy signals with its 0.6x P/S ratio. However, the P/S might be low for a reason and it requires further investigation to determine if it's justified.
View our latest analysis for AsiaMedic
How AsiaMedic Has Been Performing
The revenue growth achieved at AsiaMedic over the last year would be more than acceptable for most companies. Perhaps the market is expecting this acceptable revenue performance to take a dive, which has kept the P/S suppressed. If you like the company, you'd be hoping this isn't the case so that you could potentially pick up some stock while it's out of favour.
Want the full picture on earnings, revenue and cash flow for the company? Then our free report on AsiaMedic will help you shine a light on its historical performance.
How Is AsiaMedic's Revenue Growth Trending?
The only time you'd be truly comfortable seeing a P/S as low as AsiaMedic's is when the company's growth is on track to lag the industry.
Taking a look back first, we see that the company grew revenue by an impressive 19% last year. Pleasingly, revenue has also lifted 32% in aggregate from three years ago, thanks to the last 12 months of growth. Therefore, it's fair to say the revenue growth recently has been superb for the company.
This is in contrast to the rest of the industry, which is expected to grow by 17% over the next year, materially higher than the company's recent medium-term annualised growth rates.
In light of this, it's understandable that AsiaMedic's P/S sits below the majority of other companies. It seems most investors are expecting to see the recent limited growth rates continue into the future and are only willing to pay a reduced amount for the stock.
The Bottom Line On AsiaMedic's P/S
While the price-to-sales ratio shouldn't be the defining factor in whether you buy a stock or not, it's quite a capable barometer of revenue expectations.
In line with expectations, AsiaMedic maintains its low P/S on the weakness of its recent three-year growth being lower than the wider industry forecast. Right now shareholders are accepting the low P/S as they concede future revenue probably won't provide any pleasant surprises. Unless the recent medium-term conditions improve, they will continue to form a barrier for the share price around these levels.
And what about other risks? Every company has them, and we've spotted 3 warning signs for AsiaMedic (of which 2 are a bit unpleasant!) you should know about.
If you're unsure about the strength of AsiaMedic's business, why not explore our interactive list of stocks with solid business fundamentals for some other companies you may have missed.
Have feedback on this article? Concerned about the content? Get in touch with us directly. Alternatively, email editorial-team (at) simplywallst.com.
This article by Simply Wall St is general in nature. We provide commentary based on historical data and analyst forecasts only using an unbiased methodology and our articles are not intended to be financial advice. It does not constitute a recommendation to buy or sell any stock, and does not take account of your objectives, or your financial situation. We aim to bring you long-term focused analysis driven by fundamental data. Note that our analysis may not factor in the latest price-sensitive company announcements or qualitative material. Simply Wall St has no position in any stocks mentioned.
