
Investors in Nanjing Securities (SHSE:601990) Have Unfortunately Lost 34% Over the Last Three Years
Investors in Nanjing Securities (SHSE:601990) Have Unfortunately Lost 34% Over the Last Three Years
In order to justify the effort of selecting individual stocks, it's worth striving to beat the returns from a market index fund. But the risk of stock picking is that you will likely buy under-performing companies. We regret to report that long term Nanjing Securities Co., Ltd. (SHSE:601990) shareholders have had that experience, with the share price dropping 37% in three years, versus a market decline of about 8.9%.
爲了證明選擇個股的努力是合理的,值得努力超越市場指數基金的回報。但是選股的風險在於你可能會買入表現不佳的公司。從長遠來看,我們很遺憾地向大家報告 南京證券有限責任公司 (SHSE: 601990) 股東也有過這樣的經歷,股價在三年內下跌了37%,而市場跌幅約爲8.9%。
So let's have a look and see if the longer term performance of the company has been in line with the underlying business' progress.
因此,讓我們來看看公司的長期表現是否與基礎業務的進展一致。
View our latest analysis for Nanjing Securities
查看我們對南京證券的最新分析
To paraphrase Benjamin Graham: Over the short term the market is a voting machine, but over the long term it's a weighing machine. One way to examine how market sentiment has changed over time is to look at the interaction between a company's share price and its earnings per share (EPS).
用本傑明·格雷厄姆的話來說:從短期來看,市場是一臺投票機器,但從長遠來看,它是一臺稱重機。研究市場情緒如何隨着時間的推移而變化的一種方法是研究公司股價與其每股收益(EPS)之間的相互作用。
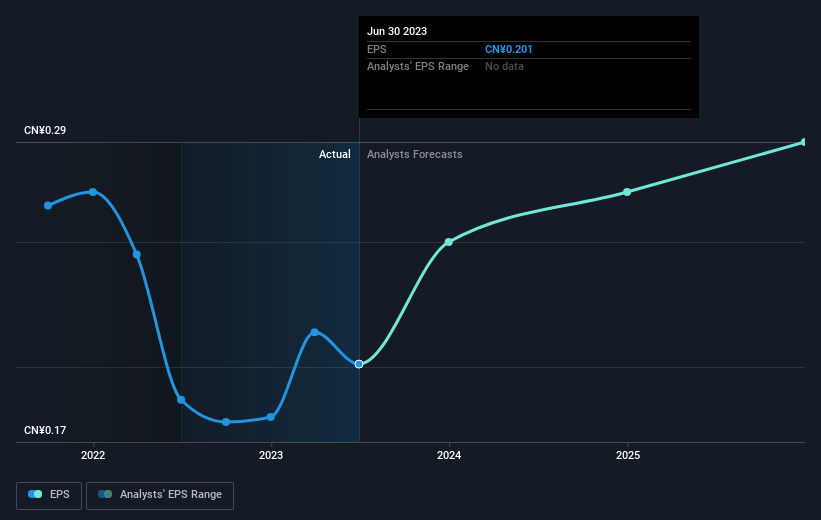
Nanjing Securities saw its EPS decline at a compound rate of 8.3% per year, over the last three years. The share price decline of 14% is actually steeper than the EPS slippage. So it's likely that the EPS decline has disappointed the market, leaving investors hesitant to buy.
在過去三年中,南京證券的每股收益複合年率下降8.3%。14%的股價跌幅實際上比每股收益的下滑幅度更大。因此,每股收益的下降很可能令市場失望,使投資者對買入猶豫不決。
The company's earnings per share (over time) is depicted in the image below (click to see the exact numbers).
該公司的每股收益(隨着時間的推移)如下圖所示(點擊查看確切數字)。
Dive deeper into Nanjing Securities' key metrics by checking this interactive graph of Nanjing Securities's earnings, revenue and cash flow.
查看這張南京證券收益、收入和現金流的交互式圖表,深入了解南京證券的關鍵指標。
What About Dividends?
分紅呢?
It is important to consider the total shareholder return, as well as the share price return, for any given stock. Whereas the share price return only reflects the change in the share price, the TSR includes the value of dividends (assuming they were reinvested) and the benefit of any discounted capital raising or spin-off. So for companies that pay a generous dividend, the TSR is often a lot higher than the share price return. We note that for Nanjing Securities the TSR over the last 3 years was -34%, which is better than the share price return mentioned above. This is largely a result of its dividend payments!
重要的是要考慮任何給定股票的股東總回報率以及股價回報。股價回報僅反映股價的變化,而股東總回報率包括股息的價值(假設股息已被再投資)以及任何折扣融資或分拆的收益。因此,對於支付豐厚股息的公司來說,股東總回報率通常遠高於股價回報。我們注意到,南京證券過去3年的股東總回報率爲-34%,好於上述股價回報率。這在很大程度上是其股息支付的結果!
A Different Perspective
不同的視角
It's nice to see that Nanjing Securities shareholders have received a total shareholder return of 2.9% over the last year. And that does include the dividend. That certainly beats the loss of about 1.3% per year over the last half decade. This makes us a little wary, but the business might have turned around its fortunes. I find it very interesting to look at share price over the long term as a proxy for business performance. But to truly gain insight, we need to consider other information, too. For example, we've discovered 1 warning sign for Nanjing Securities that you should be aware of before investing here.
很高興看到南京證券股東在去年獲得了2.9%的股東總回報率。這確實包括股息。這無疑超過了過去五年中每年約1.3%的損失。這讓我們有點警惕,但企業可能已經扭轉了局面。我發現從長遠來看,將股價視爲業務表現的代表非常有趣。但是,要真正獲得見解,我們還需要考慮其他信息。例如,我們發現了 南京證券有 1 個警告標誌 在這裏投資之前,你應該注意這一點。
For those who like to find winning investments this free list of growing companies with recent insider purchasing, could be just the ticket.
對於那些喜歡尋找的人 獲勝的投資 這個 免費的 最近進行內幕收購的成長型公司名單可能只是門票。
Please note, the market returns quoted in this article reflect the market weighted average returns of stocks that currently trade on Chinese exchanges.
請注意,本文引用的市場回報反映了目前在中國交易所交易的股票的市場加權平均回報。
Have feedback on this article? Concerned about the content? Get in touch with us directly. Alternatively, email editorial-team (at) simplywallst.com.
This article by Simply Wall St is general in nature. We provide commentary based on historical data and analyst forecasts only using an unbiased methodology and our articles are not intended to be financial advice. It does not constitute a recommendation to buy or sell any stock, and does not take account of your objectives, or your financial situation. We aim to bring you long-term focused analysis driven by fundamental data. Note that our analysis may not factor in the latest price-sensitive company announcements or qualitative material. Simply Wall St has no position in any stocks mentioned.
對這篇文章有反饋嗎?擔心內容嗎? 取得聯繫 直接和我們在一起。 或者,給編輯團隊 (at) simplywallst.com 發送電子郵件。
Simply Wall St 的這篇文章本質上是籠統的。 我們僅使用公正的方法根據歷史數據和分析師的預測提供評論,我們的文章無意作爲財務建議。 它不構成買入或賣出任何股票的建議,也沒有考慮您的目標或財務狀況。我們的目標是爲您提供由基本面數據驅動的長期重點分析。請注意,我們的分析可能不考慮最新的價格敏感公司公告或定性材料。簡而言之,華爾街在上述任何股票中都沒有頭寸。
譯文內容由第三人軟體翻譯。