Estimating The Fair Value Of K. Seng Seng Corporation Berhad (KLSE:KSSC)
Key Insights
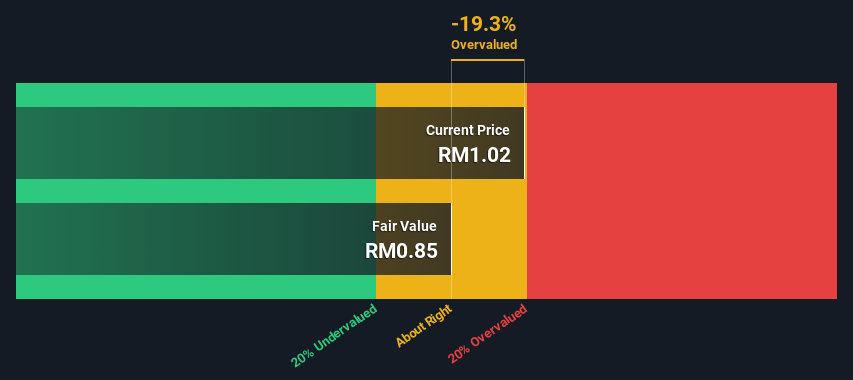
The projected fair value for K. Seng Seng Corporation Berhad is RM0.85 based on 2 Stage Free Cash Flow to Equity
K. Seng Seng Corporation Berhad's RM1.02 share price indicates it is trading at similar levels as its fair value estimate
K. Seng Seng Corporation Berhad's peers seem to be trading at a higher premium to fair value based onthe industry average of -215%
Today we'll do a simple run through of a valuation method used to estimate the attractiveness of K. Seng Seng Corporation Berhad (KLSE:KSSC) as an investment opportunity by projecting its future cash flows and then discounting them to today's value. We will take advantage of the Discounted Cash Flow (DCF) model for this purpose. Believe it or not, it's not too difficult to follow, as you'll see from our example!
We generally believe that a company's value is the present value of all of the cash it will generate in the future. However, a DCF is just one valuation metric among many, and it is not without flaws. If you want to learn more about discounted cash flow, the rationale behind this calculation can be read in detail in the Simply Wall St analysis model.
See our latest analysis for K. Seng Seng Corporation Berhad
What's The Estimated Valuation?
We are going to use a two-stage DCF model, which, as the name states, takes into account two stages of growth. The first stage is generally a higher growth period which levels off heading towards the terminal value, captured in the second 'steady growth' period. In the first stage we need to estimate the cash flows to the business over the next ten years. Seeing as no analyst estimates of free cash flow are available to us, we have extrapolate the previous free cash flow (FCF) from the company's last reported value. We assume companies with shrinking free cash flow will slow their rate of shrinkage, and that companies with growing free cash flow will see their growth rate slow, over this period. We do this to reflect that growth tends to slow more in the early years than it does in later years.
A DCF is all about the idea that a dollar in the future is less valuable than a dollar today, and so the sum of these future cash flows is then discounted to today's value:
10-year free cash flow (FCF) estimate
2024 | 2025 | 2026 | 2027 | 2028 | 2029 | 2030 | 2031 | 2032 | 2033 | |
Levered FCF (MYR, Millions) | RM5.77m | RM7.96m | RM10.1m | RM12.2m | RM14.1m | RM15.7m | RM17.2m | RM18.5m | RM19.7m | RM20.8m |
Growth Rate Estimate Source | Est @ 52.45% | Est @ 37.78% | Est @ 27.51% | Est @ 20.32% | Est @ 15.29% | Est @ 11.77% | Est @ 9.30% | Est @ 7.58% | Est @ 6.37% | Est @ 5.52% |
Present Value (MYR, Millions) Discounted @ 13% | RM5.1 | RM6.2 | RM7.0 | RM7.4 | RM7.5 | RM7.4 | RM7.1 | RM6.8 | RM6.3 | RM5.9 |
("Est" = FCF growth rate estimated by Simply Wall St)
Present Value of 10-year Cash Flow (PVCF) = RM67m
The second stage is also known as Terminal Value, this is the business's cash flow after the first stage. The Gordon Growth formula is used to calculate Terminal Value at a future annual growth rate equal to the 5-year average of the 10-year government bond yield of 3.6%. We discount the terminal cash flows to today's value at a cost of equity of 13%.
Terminal Value (TV)= FCF2033 × (1 + g) ÷ (r – g) = RM21m× (1 + 3.6%) ÷ (13%– 3.6%) = RM218m
Present Value of Terminal Value (PVTV)= TV / (1 + r)10= RM218m÷ ( 1 + 13%)10= RM62m
The total value is the sum of cash flows for the next ten years plus the discounted terminal value, which results in the Total Equity Value, which in this case is RM128m. To get the intrinsic value per share, we divide this by the total number of shares outstanding. Compared to the current share price of RM1.0, the company appears around fair value at the time of writing. The assumptions in any calculation have a big impact on the valuation, so it is better to view this as a rough estimate, not precise down to the last cent.
The Assumptions
We would point out that the most important inputs to a discounted cash flow are the discount rate and of course the actual cash flows. Part of investing is coming up with your own evaluation of a company's future performance, so try the calculation yourself and check your own assumptions. The DCF also does not consider the possible cyclicality of an industry, or a company's future capital requirements, so it does not give a full picture of a company's potential performance. Given that we are looking at K. Seng Seng Corporation Berhad as potential shareholders, the cost of equity is used as the discount rate, rather than the cost of capital (or weighted average cost of capital, WACC) which accounts for debt. In this calculation we've used 13%, which is based on a levered beta of 1.447. Beta is a measure of a stock's volatility, compared to the market as a whole. We get our beta from the industry average beta of globally comparable companies, with an imposed limit between 0.8 and 2.0, which is a reasonable range for a stable business.
SWOT Analysis for K. Seng Seng Corporation Berhad
Strength
No major strengths identified for KSSC.
Weakness
Current share price is above our estimate of fair value.
Shareholders have been diluted in the past year.
Opportunity
Has sufficient cash runway for more than 3 years based on current free cash flows.
Lack of analyst coverage makes it difficult to determine KSSC's earnings prospects.
Threat
Debt is not well covered by operating cash flow.
Next Steps:
Whilst important, the DCF calculation shouldn't be the only metric you look at when researching a company. DCF models are not the be-all and end-all of investment valuation. Preferably you'd apply different cases and assumptions and see how they would impact the company's valuation. For example, changes in the company's cost of equity or the risk free rate can significantly impact the valuation. For K. Seng Seng Corporation Berhad, we've compiled three essential factors you should look at:
Risks: We feel that you should assess the 3 warning signs for K. Seng Seng Corporation Berhad (1 is significant!) we've flagged before making an investment in the company.
Other High Quality Alternatives: Do you like a good all-rounder? Explore our interactive list of high quality stocks to get an idea of what else is out there you may be missing!
Other Environmentally-Friendly Companies: Concerned about the environment and think consumers will buy eco-friendly products more and more? Browse through our interactive list of companies that are thinking about a greener future to discover some stocks you may not have thought of!
PS. Simply Wall St updates its DCF calculation for every Malaysian stock every day, so if you want to find the intrinsic value of any other stock just search here.
Have feedback on this article? Concerned about the content? Get in touch with us directly. Alternatively, email editorial-team (at) simplywallst.com.
This article by Simply Wall St is general in nature. We provide commentary based on historical data and analyst forecasts only using an unbiased methodology and our articles are not intended to be financial advice. It does not constitute a recommendation to buy or sell any stock, and does not take account of your objectives, or your financial situation. We aim to bring you long-term focused analysis driven by fundamental data. Note that our analysis may not factor in the latest price-sensitive company announcements or qualitative material. Simply Wall St has no position in any stocks mentioned.
