Is Oiltek International Limited's (Catalist:HQU) Latest Stock Performance Being Led By Its Strong Fundamentals?
Oiltek International's (Catalist:HQU) stock up by 4.9% over the past month. Given that the market rewards strong financials in the long-term, we wonder if that is the case in this instance. In this article, we decided to focus on Oiltek International's ROE.
ROE or return on equity is a useful tool to assess how effectively a company can generate returns on the investment it received from its shareholders. In short, ROE shows the profit each dollar generates with respect to its shareholder investments.
View our latest analysis for Oiltek International
How To Calculate Return On Equity?
Return on equity can be calculated by using the formula:
Return on Equity = Net Profit (from continuing operations) ÷ Shareholders' Equity
So, based on the above formula, the ROE for Oiltek International is:
27% = RM15m ÷ RM55m (Based on the trailing twelve months to June 2023).
The 'return' is the yearly profit. One way to conceptualize this is that for each SGD1 of shareholders' capital it has, the company made SGD0.27 in profit.
What Is The Relationship Between ROE And Earnings Growth?
We have already established that ROE serves as an efficient profit-generating gauge for a company's future earnings. Based on how much of its profits the company chooses to reinvest or "retain", we are then able to evaluate a company's future ability to generate profits. Assuming everything else remains unchanged, the higher the ROE and profit retention, the higher the growth rate of a company compared to companies that don't necessarily bear these characteristics.
A Side By Side comparison of Oiltek International's Earnings Growth And 27% ROE
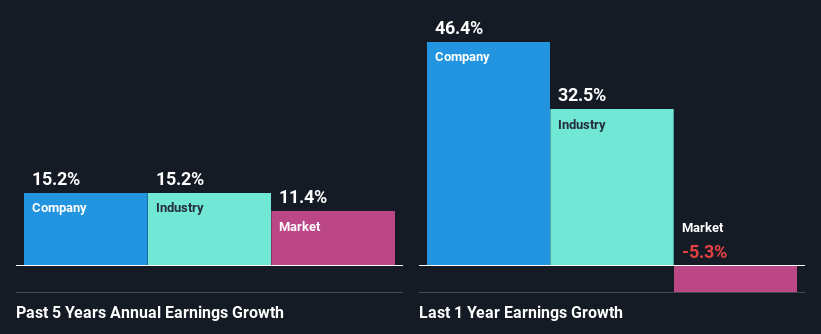
Firstly, we acknowledge that Oiltek International has a significantly high ROE. Second, a comparison with the average ROE reported by the industry of 7.3% also doesn't go unnoticed by us. Probably as a result of this, Oiltek International was able to see a decent net income growth of 15% over the last five years.
We then performed a comparison between Oiltek International's net income growth with the industry, which revealed that the company's growth is similar to the average industry growth of 15% in the same 5-year period.
Earnings growth is an important metric to consider when valuing a stock. The investor should try to establish if the expected growth or decline in earnings, whichever the case may be, is priced in. This then helps them determine if the stock is placed for a bright or bleak future. Is Oiltek International fairly valued compared to other companies? These 3 valuation measures might help you decide.
Is Oiltek International Making Efficient Use Of Its Profits?
Oiltek International has a healthy combination of a moderate three-year median payout ratio of 40% (or a retention ratio of 60%) and a respectable amount of growth in earnings as we saw above, meaning that the company has been making efficient use of its profits.
While Oiltek International has seen growth in its earnings, it only recently started to pay a dividend. It is most likely that the company decided to impress new and existing shareholders with a dividend.
Summary
Overall, we are quite pleased with Oiltek International's performance. Specifically, we like that the company is reinvesting a huge chunk of its profits at a high rate of return. This of course has caused the company to see substantial growth in its earnings. If the company continues to grow its earnings the way it has, that could have a positive impact on its share price given how earnings per share influence long-term share prices. Not to forget, share price outcomes are also dependent on the potential risks a company may face. So it is important for investors to be aware of the risks involved in the business. To know the 3 risks we have identified for Oiltek International visit our risks dashboard for free.
Have feedback on this article? Concerned about the content? Get in touch with us directly. Alternatively, email editorial-team (at) simplywallst.com.
This article by Simply Wall St is general in nature. We provide commentary based on historical data and analyst forecasts only using an unbiased methodology and our articles are not intended to be financial advice. It does not constitute a recommendation to buy or sell any stock, and does not take account of your objectives, or your financial situation. We aim to bring you long-term focused analysis driven by fundamental data. Note that our analysis may not factor in the latest price-sensitive company announcements or qualitative material. Simply Wall St has no position in any stocks mentioned.
