
 Yahoo Finance
 Returns Are Gaining Momentum At BBR Holdings (S) (SGX:KJ5)
What are the early trends we should look for to identify a stock that could multiply in value over the long term? In a perfect world, we'd like to see a company investing more capital into its business and ideally the returns earned from that capital are also increasing. If you see this, it typically means it's a company with a great business model and plenty of profitable reinvestment opportunities. With that in mind, we've noticed some promising trends at BBR Holdings (S) (SGX:KJ5) so let's look a bit deeper.
Return On Capital Employed (ROCE): What Is It?
Just to clarify if you're unsure, ROCE is a metric for evaluating how much pre-tax income (in percentage terms) a company earns on the capital invested in its business. The formula for this calculation on BBR Holdings (S) is:
Return on Capital Employed = Earnings Before Interest and Tax (EBIT) ÷ (Total Assets - Current Liabilities)
0.065 = S$15m ÷ (S$324m - S$97m) (Based on the trailing twelve months to June 2023).
Therefore, BBR Holdings (S) has an ROCE of 6.5%. In absolute terms, that's a low return, but it's much better than the Construction industry average of 3.8%.
See our latest analysis for BBR Holdings (S)
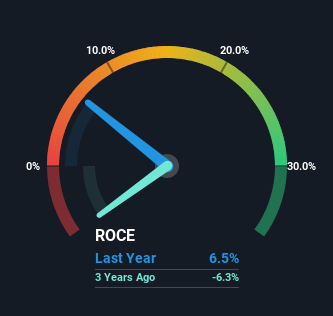
Historical performance is a great place to start when researching a stock so above you can see the gauge for BBR Holdings (S)'s ROCE against it's prior returns. If you want to delve into the historical earnings, revenue and cash flow of BBR Holdings (S), check out these free graphs here.
So How Is BBR Holdings (S)'s ROCE Trending?
BBR Holdings (S) has broken into the black (profitability) and we're sure it's a sight for sore eyes. The company now earns 6.5% on its capital, because five years ago it was incurring losses. While returns have increased, the amount of capital employed by BBR Holdings (S) has remained flat over the period. With no noticeable increase in capital employed, it's worth knowing what the company plans on doing going forward in regards to reinvesting and growing the business. So if you're looking for high growth, you'll want to see a business's capital employed also increasing.
For the record though, there was a noticeable increase in the company's current liabilities over the period, so we would attribute some of the ROCE growth to that. The current liabilities has increased to 30% of total assets, so the business is now more funded by the likes of its suppliers or short-term creditors. It's worth keeping an eye on this because as the percentage of current liabilities to total assets increases, some aspects of risk also increase.
The Bottom Line
To bring it all together, BBR Holdings (S) has done well to increase the returns it's generating from its capital employed. Astute investors may have an opportunity here because the stock has declined 33% in the last five years. That being the case, research into the company's current valuation metrics and future prospects seems fitting.
One more thing: We've identified 4 warning signs with BBR Holdings (S) (at least 1 which shouldn't be ignored) , and understanding these would certainly be useful.
While BBR Holdings (S) may not currently earn the highest returns, we've compiled a list of companies that currently earn more than 25% return on equity. Check out this free list here.
Have feedback on this article? Concerned about the content? Get in touch with us directly. Alternatively, email editorial-team (at) simplywallst.com.
This article by Simply Wall St is general in nature. We provide commentary based on historical data and analyst forecasts only using an unbiased methodology and our articles are not intended to be financial advice. It does not constitute a recommendation to buy or sell any stock, and does not take account of your objectives, or your financial situation. We aim to bring you long-term focused analysis driven by fundamental data. Note that our analysis may not factor in the latest price-sensitive company announcements or qualitative material. Simply Wall St has no position in any stocks mentioned.
