Has HiTech Group Australia Limited's (ASX:HIT) Impressive Stock Performance Got Anything to Do With Its Fundamentals?
Most readers would already be aware that HiTech Group Australia's (ASX:HIT) stock increased significantly by 16% over the past three months. As most would know, fundamentals are what usually guide market price movements over the long-term, so we decided to look at the company's key financial indicators today to determine if they have any role to play in the recent price movement. In this article, we decided to focus on HiTech Group Australia's ROE.
Return on equity or ROE is a key measure used to assess how efficiently a company's management is utilizing the company's capital. In other words, it is a profitability ratio which measures the rate of return on the capital provided by the company's shareholders.
Check out our latest analysis for HiTech Group Australia
How To Calculate Return On Equity?
The formula for return on equity is:
Return on Equity = Net Profit (from continuing operations) ÷ Shareholders' Equity
So, based on the above formula, the ROE for HiTech Group Australia is:
71% = AU$5.4m ÷ AU$7.6m (Based on the trailing twelve months to June 2023).
The 'return' is the yearly profit. One way to conceptualize this is that for each A$1 of shareholders' capital it has, the company made A$0.71 in profit.
What Is The Relationship Between ROE And Earnings Growth?
So far, we've learned that ROE is a measure of a company's profitability. We now need to evaluate how much profit the company reinvests or "retains" for future growth which then gives us an idea about the growth potential of the company. Generally speaking, other things being equal, firms with a high return on equity and profit retention, have a higher growth rate than firms that don’t share these attributes.
HiTech Group Australia's Earnings Growth And 71% ROE
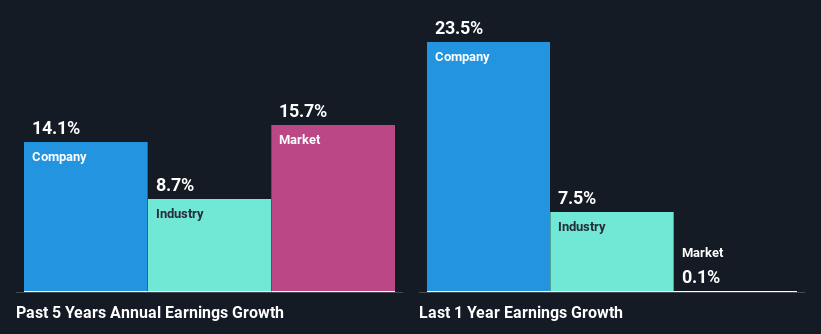
Firstly, we acknowledge that HiTech Group Australia has a significantly high ROE. Secondly, even when compared to the industry average of 14% the company's ROE is quite impressive. Probably as a result of this, HiTech Group Australia was able to see a decent net income growth of 14% over the last five years.
Next, on comparing with the industry net income growth, we found that HiTech Group Australia's growth is quite high when compared to the industry average growth of 8.7% in the same period, which is great to see.
Earnings growth is an important metric to consider when valuing a stock. The investor should try to establish if the expected growth or decline in earnings, whichever the case may be, is priced in. This then helps them determine if the stock is placed for a bright or bleak future. Is HIT fairly valued? This infographic on the company's intrinsic value has everything you need to know.
Is HiTech Group Australia Making Efficient Use Of Its Profits?
HiTech Group Australia has a significant three-year median payout ratio of 97%, meaning that it is left with only 3.5% to reinvest into its business. This implies that the company has been able to achieve decent earnings growth despite returning most of its profits to shareholders.
Moreover, HiTech Group Australia is determined to keep sharing its profits with shareholders which we infer from its long history of paying a dividend for at least ten years.
Conclusion
On the whole, we do feel that HiTech Group Australia has some positive attributes. Specifically, its high ROE which likely led to the growth in earnings. Bear in mind, the company reinvests little to none of its profits, which means that investors aren't necessarily reaping the full benefits of the high rate of return. Until now, we have only just grazed the surface of the company's past performance by looking at the company's fundamentals. You can do your own research on HiTech Group Australia and see how it has performed in the past by looking at this FREE detailed graph of past earnings, revenue and cash flows.
Have feedback on this article? Concerned about the content? Get in touch with us directly. Alternatively, email editorial-team (at) simplywallst.com.
This article by Simply Wall St is general in nature. We provide commentary based on historical data and analyst forecasts only using an unbiased methodology and our articles are not intended to be financial advice. It does not constitute a recommendation to buy or sell any stock, and does not take account of your objectives, or your financial situation. We aim to bring you long-term focused analysis driven by fundamental data. Note that our analysis may not factor in the latest price-sensitive company announcements or qualitative material. Simply Wall St has no position in any stocks mentioned.
