
 Yahoo Finance
 Ainsworth Game Technology (ASX:AGI) Is Finding It Tricky To Allocate Its Capital
What financial metrics can indicate to us that a company is maturing or even in decline? Typically, we'll see the trend of both return on capital employed (ROCE) declining and this usually coincides with a decreasing amount of capital employed. This indicates to us that the business is not only shrinking the size of its net assets, but its returns are falling as well. So after we looked into Ainsworth Game Technology (ASX:AGI), the trends above didn't look too great.
Understanding Return On Capital Employed (ROCE)
If you haven't worked with ROCE before, it measures the 'return' (pre-tax profit) a company generates from capital employed in its business. The formula for this calculation on Ainsworth Game Technology is:
Return on Capital Employed = Earnings Before Interest and Tax (EBIT) ÷ (Total Assets - Current Liabilities)
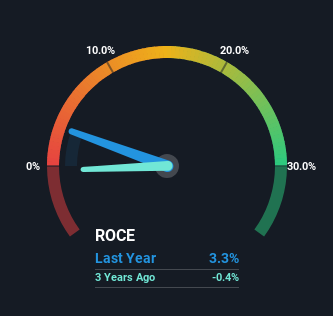
0.033 = AU$11m ÷ (AU$426m - AU$93m) (Based on the trailing twelve months to December 2022).
So, Ainsworth Game Technology has an ROCE of 3.3%. Ultimately, that's a low return and it under-performs the Hospitality industry average of 7.0%.
Check out our latest analysis for Ainsworth Game Technology
In the above chart we have measured Ainsworth Game Technology's prior ROCE against its prior performance, but the future is arguably more important. If you'd like, you can check out the forecasts from the analysts covering Ainsworth Game Technology here for free.
What Does the ROCE Trend For Ainsworth Game Technology Tell Us?
The trend of ROCE at Ainsworth Game Technology is showing some signs of weakness. Unfortunately, returns have declined substantially over the last five years to the 3.3% we see today. What's equally concerning is that the amount of capital deployed in the business has shrunk by 21% over that same period. The fact that both are shrinking is an indication that the business is going through some tough times. If these underlying trends continue, we wouldn't be too optimistic going forward.
On a side note, Ainsworth Game Technology's current liabilities have increased over the last five years to 22% of total assets, effectively distorting the ROCE to some degree. Without this increase, it's likely that ROCE would be even lower than 3.3%. Keep an eye on this ratio, because the business could encounter some new risks if this metric gets too high.
Our Take On Ainsworth Game Technology's ROCE
In summary, it's unfortunate that Ainsworth Game Technology is shrinking its capital base and also generating lower returns. And, the stock has remained flat over the last five years, so investors don't seem too impressed either. Unless there is a shift to a more positive trajectory in these metrics, we would look elsewhere.
One more thing to note, we've identified 1 warning sign with Ainsworth Game Technology and understanding this should be part of your investment process.
While Ainsworth Game Technology may not currently earn the highest returns, we've compiled a list of companies that currently earn more than 25% return on equity. Check out this free list here.
Have feedback on this article? Concerned about the content? Get in touch with us directly. Alternatively, email editorial-team (at) simplywallst.com.
This article by Simply Wall St is general in nature. We provide commentary based on historical data and analyst forecasts only using an unbiased methodology and our articles are not intended to be financial advice. It does not constitute a recommendation to buy or sell any stock, and does not take account of your objectives, or your financial situation. We aim to bring you long-term focused analysis driven by fundamental data. Note that our analysis may not factor in the latest price-sensitive company announcements or qualitative material. Simply Wall St has no position in any stocks mentioned.
