
 Yahoo Finance
 Potential Upside For Tritech Group Limited (Catalist:5G9) Not Without Risk
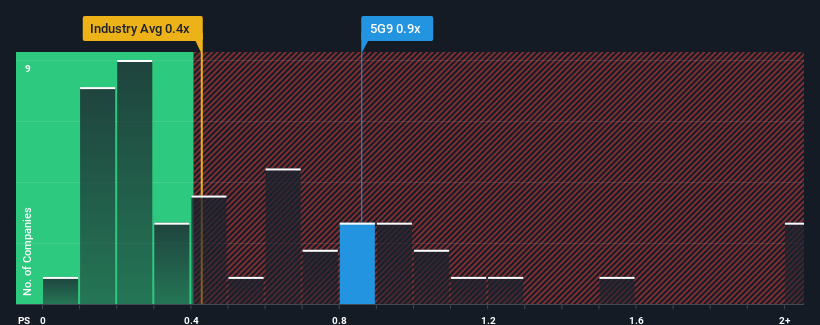
It's not a stretch to say that Tritech Group Limited's (Catalist:5G9) price-to-sales (or "P/S") ratio of 0.9x right now seems quite "middle-of-the-road" for companies in the Construction industry in Singapore, where the median P/S ratio is around 0.4x. While this might not raise any eyebrows, if the P/S ratio is not justified investors could be missing out on a potential opportunity or ignoring looming disappointment.
View our latest analysis for Tritech Group
How Has Tritech Group Performed Recently?
It looks like revenue growth has deserted Tritech Group recently, which is not something to boast about. One possibility is that the P/S is moderate because investors think this benign revenue growth rate might not be enough to outperform the broader industry in the near future. Those who are bullish on Tritech Group will be hoping that this isn't the case, so that they can pick up the stock at a lower valuation.
Although there are no analyst estimates available for Tritech Group, take a look at this free data-rich visualisation to see how the company stacks up on earnings, revenue and cash flow.
How Is Tritech Group's Revenue Growth Trending?
In order to justify its P/S ratio, Tritech Group would need to produce growth that's similar to the industry.
Retrospectively, the last year delivered virtually the same number to the company's top line as the year before. Although pleasingly revenue has lifted 159% in aggregate from three years ago, notwithstanding the last 12 months. Therefore, it's fair to say the revenue growth recently has been great for the company, but investors will want to ask why it has slowed to such an extent.
Comparing that to the industry, which is only predicted to deliver 21% growth in the next 12 months, the company's momentum is stronger based on recent medium-term annualised revenue results.
With this information, we find it interesting that Tritech Group is trading at a fairly similar P/S compared to the industry. Apparently some shareholders believe the recent performance is at its limits and have been accepting lower selling prices.
What Does Tritech Group's P/S Mean For Investors?
Typically, we'd caution against reading too much into price-to-sales ratios when settling on investment decisions, though it can reveal plenty about what other market participants think about the company.
We didn't quite envision Tritech Group's P/S sitting in line with the wider industry, considering the revenue growth over the last three-year is higher than the current industry outlook. When we see strong revenue with faster-than-industry growth, we can only assume potential risks are what might be placing pressure on the P/S ratio. It appears some are indeed anticipating revenue instability, because the persistence of these recent medium-term conditions would normally provide a boost to the share price.
It's always necessary to consider the ever-present spectre of investment risk. We've identified 3 warning signs with Tritech Group (at least 1 which can't be ignored), and understanding them should be part of your investment process.
If these risks are making you reconsider your opinion on Tritech Group, explore our interactive list of high quality stocks to get an idea of what else is out there.
Have feedback on this article? Concerned about the content? Get in touch with us directly. Alternatively, email editorial-team (at) simplywallst.com.
This article by Simply Wall St is general in nature. We provide commentary based on historical data and analyst forecasts only using an unbiased methodology and our articles are not intended to be financial advice. It does not constitute a recommendation to buy or sell any stock, and does not take account of your objectives, or your financial situation. We aim to bring you long-term focused analysis driven by fundamental data. Note that our analysis may not factor in the latest price-sensitive company announcements or qualitative material. Simply Wall St has no position in any stocks mentioned.
Join A Paid User Research Session
You’ll receive a US$30 Amazon Gift card for 1 hour of your time while helping us build better investing tools for the individual investors like yourself. Sign up here