Investing in Grand Venture Technology (SGX:JLB) three years ago would have delivered you a 143% gain
The worst result, after buying shares in a company (assuming no leverage), would be if you lose all the money you put in. But if you buy shares in a really great company, you can more than double your money. For instance the Grand Venture Technology Limited (SGX:JLB) share price is 139% higher than it was three years ago. Most would be happy with that.
So let's investigate and see if the longer term performance of the company has been in line with the underlying business' progress.
Check out our latest analysis for Grand Venture Technology
To quote Buffett, 'Ships will sail around the world but the Flat Earth Society will flourish. There will continue to be wide discrepancies between price and value in the marketplace...' One imperfect but simple way to consider how the market perception of a company has shifted is to compare the change in the earnings per share (EPS) with the share price movement.
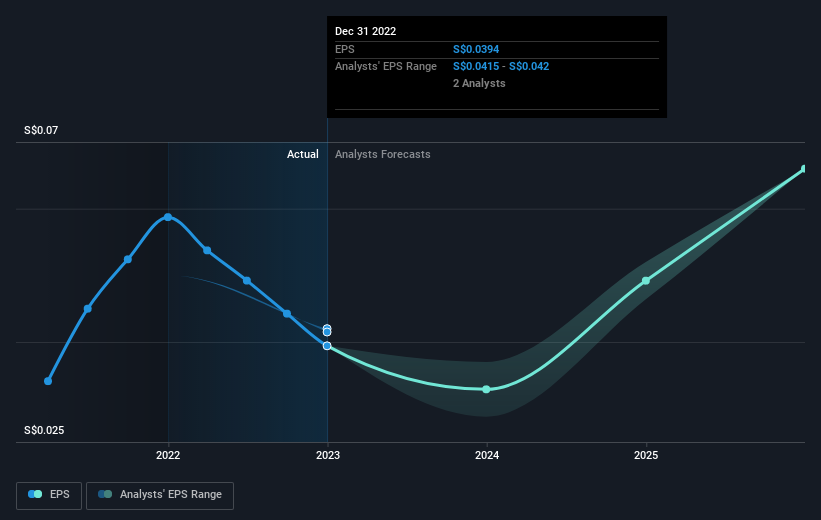
Grand Venture Technology was able to grow its EPS at 43% per year over three years, sending the share price higher. The average annual share price increase of 34% is actually lower than the EPS growth. So it seems investors have become more cautious about the company, over time.
You can see how EPS has changed over time in the image below (click on the chart to see the exact values).
We know that Grand Venture Technology has improved its bottom line over the last three years, but what does the future have in store? This free interactive report on Grand Venture Technology's balance sheet strength is a great place to start, if you want to investigate the stock further.
What About Dividends?
When looking at investment returns, it is important to consider the difference between total shareholder return (TSR) and share price return. The TSR is a return calculation that accounts for the value of cash dividends (assuming that any dividend received was reinvested) and the calculated value of any discounted capital raisings and spin-offs. It's fair to say that the TSR gives a more complete picture for stocks that pay a dividend. We note that for Grand Venture Technology the TSR over the last 3 years was 143%, which is better than the share price return mentioned above. And there's no prize for guessing that the dividend payments largely explain the divergence!
A Different Perspective
The last twelve months weren't great for Grand Venture Technology shares, which performed worse than the market, costing holders 35%, including dividends. Meanwhile, the broader market slid about 0.6%, likely weighing on the stock. Investors are up over three years, booking 35% per year, much better than the more recent returns. Sometimes when a good quality long term winner has a weak period, it's turns out to be an opportunity, but you really need to be sure that the quality is there. It's always interesting to track share price performance over the longer term. But to understand Grand Venture Technology better, we need to consider many other factors. Consider risks, for instance. Every company has them, and we've spotted 1 warning sign for Grand Venture Technology you should know about.
If you are like me, then you will not want to miss this free list of growing companies that insiders are buying.
Please note, the market returns quoted in this article reflect the market weighted average returns of stocks that currently trade on Singaporean exchanges.
Have feedback on this article? Concerned about the content? Get in touch with us directly. Alternatively, email editorial-team (at) simplywallst.com.
This article by Simply Wall St is general in nature. We provide commentary based on historical data and analyst forecasts only using an unbiased methodology and our articles are not intended to be financial advice. It does not constitute a recommendation to buy or sell any stock, and does not take account of your objectives, or your financial situation. We aim to bring you long-term focused analysis driven by fundamental data. Note that our analysis may not factor in the latest price-sensitive company announcements or qualitative material. Simply Wall St has no position in any stocks mentioned.
Join A Paid User Research Session
You’ll receive a US$30 Amazon Gift card for 1 hour of your time while helping us build better investing tools for the individual investors like yourself. Sign up here
