
Double Your Returns: Seize The AI And Tech Boom With This Unique 2X Leverage Fund
Double Your Returns: Seize The AI And Tech Boom With This Unique 2X Leverage Fund
 The ETF tracks a number of stocks through its holdings, with companies such as NVIDIA Corporation (NASDAQ:NVDA) weighted at 8.91%, Intuitive Surgical, Inc (NASDAQ:ISRG) weighted at 8.34% and a number of other foreign-listed companies within the sector.
Direxion Daily Robotics, Artificial Intelligence & Automation Index Bull 2X Shares (NYSE:UBOT) was trading over 3% higher on Friday after closing Thursday's session up 3.92%.
Direxion Daily Robotics、人工智能和自動化指數牛市 2X 股 紐約證券交易所代碼:UBOT)在週四收盤上漲3.92%後,週五上漲了3%以上。
AI and tech stocks have experienced a strong rally recently as automation becomes more advanced and integrated into people's daily lives.
隨着自動化變得越來越先進並融入人們的日常生活,人工智能和科技股最近經歷了強勁的上漲。
UBOT is a double-leveraged fund that offers 2x daily leverage to bullish movements across a variety of stocks in the robotics, AI and automation sector.
UBOT是一家雙槓杆基金,爲機器人、人工智能和自動化領域各種股票的看漲走勢提供2倍的每日槓桿率。
The ETF tracks a number of stocks through its holdings, with companies such as NVIDIA Corporation (NASDAQ:NVDA) weighted at 8.91%, Intuitive Surgical, Inc (NASDAQ:ISRG) weighted at 8.34% and a number of other foreign-listed companies within the sector.
該ETF通過其持有的股票追蹤了多隻股票,例如 英偉達公司 (納斯達克股票代碼:NVDA)的加權爲8.91%, 直覺外科公司 納斯達克股票代碼:ISRG)的權重爲8.34%,該行業還有其他一些外國上市公司。
It should be noted that leveraged ETFs are meant to be used as a trading vehicle as opposed to long-term investments by experienced traders. Leveraged ETFs should never be used by an investor with a buy-and-hold strategy or those who have low-risk appetites.
應該指出的是,槓桿ETF旨在用作交易工具,而不是由經驗豐富的交易者進行長期投資。採用買入並持有策略的投資者或具有低風險偏好的投資者不應使用槓桿ETF。
Want direct analysis? Find me in the BZ Pro lounge! Click here for a free trial.
想要直接分析?在 BZ Pro 休息室找我!點擊此處免費試用。
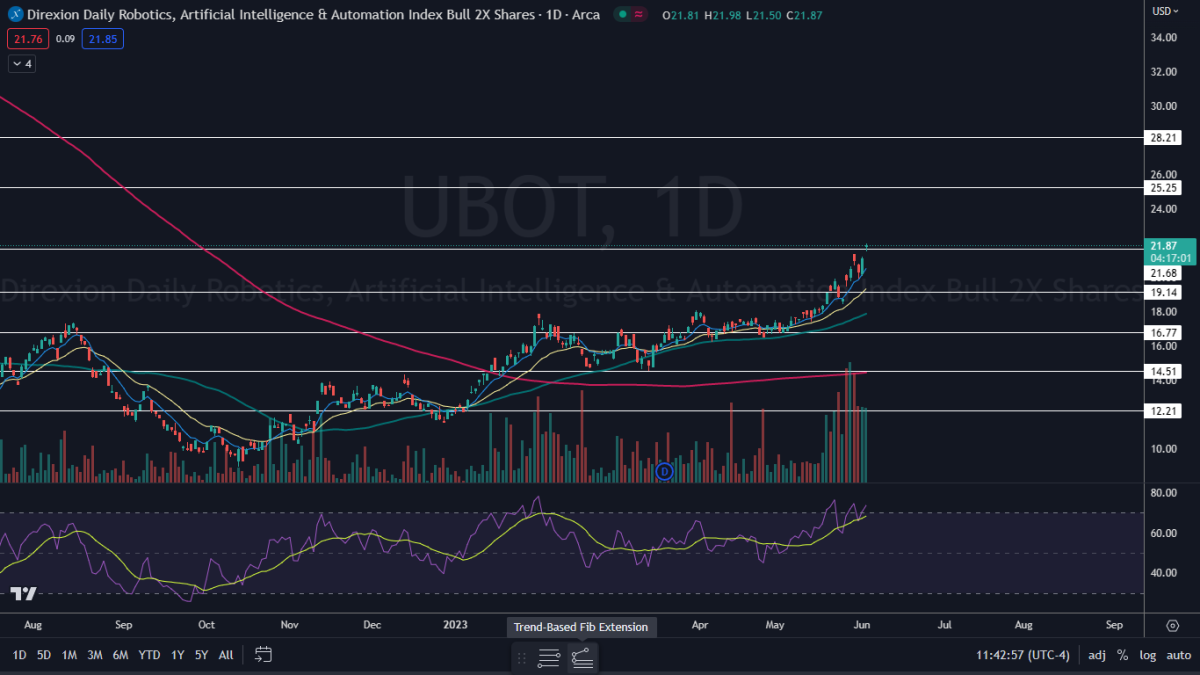
The UBOT Chart: UBOT gapped up to open Friday's trading session and was trading near its opening price. The trading action had the ETF looking to print a doji candlestick, which could indicate the local top has occurred and UBOT will retrace on Monday.
UBOT 圖表: UBOT 突然開啓了週五的交易時段,交易價格接近開盤價。該交易行動使ETF希望打印十字星蠟燭圖,這可能表明局部頂部已經出現,UBOT將在週一回落。
- The ETF has been trading in a fairly consistent uptrend since March 15, making a series of higher highs and higher lows. UBOT's most recent higher low within the pattern was formed on Wednesday at $19.93 and the most recent confirmed higher high was printed at the $21.38 mark the day prior.
- A pullback, at least for the ETF to print another higher low is likely to come over the next few trading days because UBOT's relative strength index (RSI) is measuring in at about 73%. When a stock or ETF's RSI reaches or exceeds the 70% mark, it becomes overbought, which can be a sell signal for technical traders.
- UBOT has resistance above at $25.25 and $28.21 and support below at $21.68 and $19.14.
- 自3月15日以來,該ETF一直處於相當穩定的上漲趨勢中,創出了一系列更高的高點和更高的低點。UBOT在該模式內的最新較高低點於週三形成,爲19.93美元,最近確認的更高高點在前一天印在21.38美元大關。
- 由於UBOT的相對強弱指數(RSI)約爲73%,因此在接下來的幾個交易日內,至少ETF可能會再次出現回調。當股票或ETF的RSI達到或超過70%大關時,它將變爲超買,這對於技術交易者來說可能是賣出信號。
- UBOT的阻力位在25.25美元和28.21美元上方,支撐位在21.68美元和19.14美元下方。
 Read Next: Which Stocks Are Responding To The Strong Jobs Report? 10 Top Movers
繼續閱讀:哪些股票對強勁的就業報告做出了回應?10 大推動者
譯文內容由第三人軟體翻譯。
