
 Yahoo Finance
 Q & M Dental Group (Singapore)'s (SGX:QC7) Returns Have Hit A Wall
What are the early trends we should look for to identify a stock that could multiply in value over the long term? In a perfect world, we'd like to see a company investing more capital into its business and ideally the returns earned from that capital are also increasing. If you see this, it typically means it's a company with a great business model and plenty of profitable reinvestment opportunities. That's why when we briefly looked at Q & M Dental Group (Singapore)'s (SGX:QC7) ROCE trend, we were pretty happy with what we saw.
Understanding Return On Capital Employed (ROCE)
For those who don't know, ROCE is a measure of a company's yearly pre-tax profit (its return), relative to the capital employed in the business. To calculate this metric for Q & M Dental Group (Singapore), this is the formula:
Return on Capital Employed = Earnings Before Interest and Tax (EBIT) ÷ (Total Assets - Current Liabilities)
0.10 = S$24m ÷ (S$267m - S$33m) (Based on the trailing twelve months to December 2022).
Therefore, Q & M Dental Group (Singapore) has an ROCE of 10%. In absolute terms, that's a pretty normal return, and it's somewhat close to the Healthcare industry average of 11%.
View our latest analysis for Q & M Dental Group (Singapore)
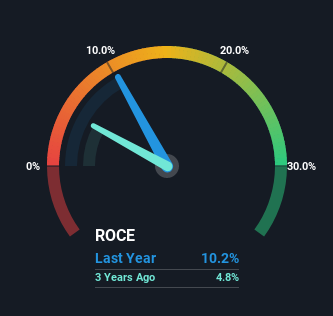
In the above chart we have measured Q & M Dental Group (Singapore)'s prior ROCE against its prior performance, but the future is arguably more important. If you're interested, you can view the analysts predictions in our free report on analyst forecasts for the company.
What Does the ROCE Trend For Q & M Dental Group (Singapore) Tell Us?
The trend of ROCE doesn't stand out much, but returns on a whole are decent. The company has consistently earned 10% for the last five years, and the capital employed within the business has risen 65% in that time. 10% is a pretty standard return, and it provides some comfort knowing that Q & M Dental Group (Singapore) has consistently earned this amount. Stable returns in this ballpark can be unexciting, but if they can be maintained over the long run, they often provide nice rewards to shareholders.
One more thing to note, even though ROCE has remained relatively flat over the last five years, the reduction in current liabilities to 12% of total assets, is good to see from a business owner's perspective. This can eliminate some of the risks inherent in the operations because the business has less outstanding obligations to their suppliers and or short-term creditors than they did previously.
Our Take On Q & M Dental Group (Singapore)'s ROCE
In the end, Q & M Dental Group (Singapore) has proven its ability to adequately reinvest capital at good rates of return. However, despite the favorable fundamentals, the stock has fallen 17% over the last five years, so there might be an opportunity here for astute investors. For that reason, savvy investors might want to look further into this company in case it's a prime investment.
On a final note, we've found 4 warning signs for Q & M Dental Group (Singapore) that we think you should be aware of.
While Q & M Dental Group (Singapore) isn't earning the highest return, check out this free list of companies that are earning high returns on equity with solid balance sheets.
Have feedback on this article? Concerned about the content? Get in touch with us directly. Alternatively, email editorial-team (at) simplywallst.com.
This article by Simply Wall St is general in nature. We provide commentary based on historical data and analyst forecasts only using an unbiased methodology and our articles are not intended to be financial advice. It does not constitute a recommendation to buy or sell any stock, and does not take account of your objectives, or your financial situation. We aim to bring you long-term focused analysis driven by fundamental data. Note that our analysis may not factor in the latest price-sensitive company announcements or qualitative material. Simply Wall St has no position in any stocks mentioned.
Join A Paid User Research Session
You’ll receive a US$30 Amazon Gift card for 1 hour of your time while helping us build better investing tools for the individual investors like yourself. Sign up here
