
 Yahoo Finance
 International Cement Group (SGX:KUO) Shareholders Will Want The ROCE Trajectory To Continue
If we want to find a stock that could multiply over the long term, what are the underlying trends we should look for? Firstly, we'll want to see a proven return on capital employed (ROCE) that is increasing, and secondly, an expanding base of capital employed. Ultimately, this demonstrates that it's a business that is reinvesting profits at increasing rates of return. So on that note, International Cement Group (SGX:KUO) looks quite promising in regards to its trends of return on capital.
Return On Capital Employed (ROCE): What Is It?
For those that aren't sure what ROCE is, it measures the amount of pre-tax profits a company can generate from the capital employed in its business. To calculate this metric for International Cement Group, this is the formula:
Return on Capital Employed = Earnings Before Interest and Tax (EBIT) ÷ (Total Assets - Current Liabilities)
0.14 = S$60m ÷ (S$488m - S$66m) (Based on the trailing twelve months to December 2022).
So, International Cement Group has an ROCE of 14%. On its own, that's a standard return, however it's much better than the 7.6% generated by the Basic Materials industry.
View our latest analysis for International Cement Group
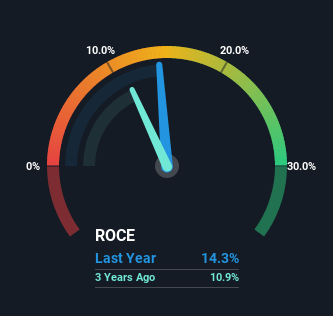
While the past is not representative of the future, it can be helpful to know how a company has performed historically, which is why we have this chart above. If you'd like to look at how International Cement Group has performed in the past in other metrics, you can view this free graph of past earnings, revenue and cash flow.
So How Is International Cement Group's ROCE Trending?
Investors would be pleased with what's happening at International Cement Group. Over the last five years, returns on capital employed have risen substantially to 14%. Basically the business is earning more per dollar of capital invested and in addition to that, 65% more capital is being employed now too. So we're very much inspired by what we're seeing at International Cement Group thanks to its ability to profitably reinvest capital.
What We Can Learn From International Cement Group's ROCE
In summary, it's great to see that International Cement Group can compound returns by consistently reinvesting capital at increasing rates of return, because these are some of the key ingredients of those highly sought after multi-baggers. Astute investors may have an opportunity here because the stock has declined 37% in the last five years. With that in mind, we believe the promising trends warrant this stock for further investigation.
On a separate note, we've found 1 warning sign for International Cement Group you'll probably want to know about.
If you want to search for solid companies with great earnings, check out this free list of companies with good balance sheets and impressive returns on equity.
Have feedback on this article? Concerned about the content? Get in touch with us directly. Alternatively, email editorial-team (at) simplywallst.com.
This article by Simply Wall St is general in nature. We provide commentary based on historical data and analyst forecasts only using an unbiased methodology and our articles are not intended to be financial advice. It does not constitute a recommendation to buy or sell any stock, and does not take account of your objectives, or your financial situation. We aim to bring you long-term focused analysis driven by fundamental data. Note that our analysis may not factor in the latest price-sensitive company announcements or qualitative material. Simply Wall St has no position in any stocks mentioned.
Join A Paid User Research Session
You’ll receive a US$30 Amazon Gift card for 1 hour of your time while helping us build better investing tools for the individual investors like yourself. Sign up here
