
 Yahoo Finance
 Take Care Before Diving Into The Deep End On Jiutian Chemical Group Limited (Catalist:C8R)
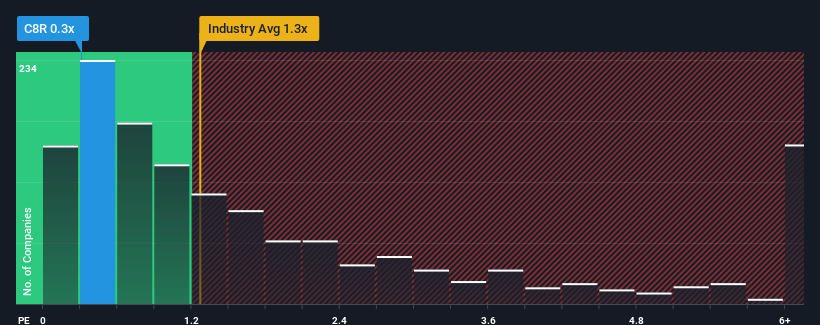
It's not a stretch to say that Jiutian Chemical Group Limited's (Catalist:C8R) price-to-sales (or "P/S") ratio of 0.3x right now seems quite "middle-of-the-road" for companies in the Chemicals industry in Singapore, where the median P/S ratio is around 0.5x. However, investors might be overlooking a clear opportunity or potential setback if there is no rational basis for the P/S.
View our latest analysis for Jiutian Chemical Group
How Jiutian Chemical Group Has Been Performing
Jiutian Chemical Group has been doing a good job lately as it's been growing revenue at a solid pace. One possibility is that the P/S is moderate because investors think this respectable revenue growth might not be enough to outperform the broader industry in the near future. Those who are bullish on Jiutian Chemical Group will be hoping that this isn't the case, so that they can pick up the stock at a lower valuation.
Want the full picture on earnings, revenue and cash flow for the company? Then our free report on Jiutian Chemical Group will help you shine a light on its historical performance.
How Is Jiutian Chemical Group's Revenue Growth Trending?
The only time you'd be comfortable seeing a P/S like Jiutian Chemical Group's is when the company's growth is tracking the industry closely.
If we review the last year of revenue growth, the company posted a worthy increase of 12%. The latest three year period has also seen an excellent 131% overall rise in revenue, aided somewhat by its short-term performance. So we can start by confirming that the company has done a great job of growing revenues over that time.
Comparing that recent medium-term revenue trajectory with the industry's one-year growth forecast of 12% shows it's noticeably more attractive.
With this information, we find it interesting that Jiutian Chemical Group is trading at a fairly similar P/S compared to the industry. It may be that most investors are not convinced the company can maintain its recent growth rates.
What Does Jiutian Chemical Group's P/S Mean For Investors?
Using the price-to-sales ratio alone to determine if you should sell your stock isn't sensible, however it can be a practical guide to the company's future prospects.
We didn't quite envision Jiutian Chemical Group's P/S sitting in line with the wider industry, considering the revenue growth over the last three-year is higher than the current industry outlook. When we see strong revenue with faster-than-industry growth, we can only assume potential risks are what might be placing pressure on the P/S ratio. At least the risk of a price drop looks to be subdued if recent medium-term revenue trends continue, but investors seem to think future revenue could see some volatility.
There are also other vital risk factors to consider and we've discovered 2 warning signs for Jiutian Chemical Group (1 can't be ignored!) that you should be aware of before investing here.
It's important to make sure you look for a great company, not just the first idea you come across. So if growing profitability aligns with your idea of a great company, take a peek at this free list of interesting companies with strong recent earnings growth (and a low P/E).
Have feedback on this article? Concerned about the content? Get in touch with us directly. Alternatively, email editorial-team (at) simplywallst.com.
This article by Simply Wall St is general in nature. We provide commentary based on historical data and analyst forecasts only using an unbiased methodology and our articles are not intended to be financial advice. It does not constitute a recommendation to buy or sell any stock, and does not take account of your objectives, or your financial situation. We aim to bring you long-term focused analysis driven by fundamental data. Note that our analysis may not factor in the latest price-sensitive company announcements or qualitative material. Simply Wall St has no position in any stocks mentioned.
Join A Paid User Research Session
You’ll receive a US$30 Amazon Gift card for 1 hour of your time while helping us build better investing tools for the individual investors like yourself. Sign up here
