
 Yahoo Finance
 Chasen Holdings (SGX:5NV) Might Be Having Difficulty Using Its Capital Effectively
Did you know there are some financial metrics that can provide clues of a potential multi-bagger? One common approach is to try and find a company with returns on capital employed (ROCE) that are increasing, in conjunction with a growing amount of capital employed. This shows us that it's a compounding machine, able to continually reinvest its earnings back into the business and generate higher returns. Although, when we looked at Chasen Holdings (SGX:5NV), it didn't seem to tick all of these boxes.
Understanding Return On Capital Employed (ROCE)
For those that aren't sure what ROCE is, it measures the amount of pre-tax profits a company can generate from the capital employed in its business. The formula for this calculation on Chasen Holdings is:
Return on Capital Employed = Earnings Before Interest and Tax (EBIT) ÷ (Total Assets - Current Liabilities)
0.06 = S$6.6m ÷ (S$196m - S$86m) (Based on the trailing twelve months to September 2022).
Thus, Chasen Holdings has an ROCE of 6.0%. On its own that's a low return on capital but it's in line with the industry's average returns of 6.4%.
View our latest analysis for Chasen Holdings
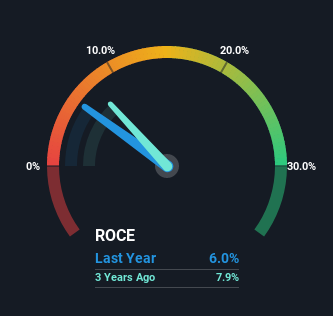
Historical performance is a great place to start when researching a stock so above you can see the gauge for Chasen Holdings' ROCE against it's prior returns. If you're interested in investigating Chasen Holdings' past further, check out this free graph of past earnings, revenue and cash flow.
What The Trend Of ROCE Can Tell Us
When we looked at the ROCE trend at Chasen Holdings, we didn't gain much confidence. Over the last five years, returns on capital have decreased to 6.0% from 12% five years ago. Meanwhile, the business is utilizing more capital but this hasn't moved the needle much in terms of sales in the past 12 months, so this could reflect longer term investments. It may take some time before the company starts to see any change in earnings from these investments.
Another thing to note, Chasen Holdings has a high ratio of current liabilities to total assets of 44%. This effectively means that suppliers (or short-term creditors) are funding a large portion of the business, so just be aware that this can introduce some elements of risk. While it's not necessarily a bad thing, it can be beneficial if this ratio is lower.
The Key Takeaway
To conclude, we've found that Chasen Holdings is reinvesting in the business, but returns have been falling. And investors appear hesitant that the trends will pick up because the stock has fallen 14% in the last five years. Therefore based on the analysis done in this article, we don't think Chasen Holdings has the makings of a multi-bagger.
If you want to know some of the risks facing Chasen Holdings we've found 5 warning signs (2 are a bit unpleasant!) that you should be aware of before investing here.
For those who like to invest in solid companies, check out this free list of companies with solid balance sheets and high returns on equity.
Have feedback on this article? Concerned about the content? Get in touch with us directly. Alternatively, email editorial-team (at) simplywallst.com.
This article by Simply Wall St is general in nature. We provide commentary based on historical data and analyst forecasts only using an unbiased methodology and our articles are not intended to be financial advice. It does not constitute a recommendation to buy or sell any stock, and does not take account of your objectives, or your financial situation. We aim to bring you long-term focused analysis driven by fundamental data. Note that our analysis may not factor in the latest price-sensitive company announcements or qualitative material. Simply Wall St has no position in any stocks mentioned.
Join A Paid User Research Session
You’ll receive a US$30 Amazon Gift card for 1 hour of your time while helping us build better investing tools for the individual investors like yourself. Sign up here
