Does ABR Holdings Limited's (SGX:533) Weak Fundamentals Mean A Downturn In Its Stock Should Be Expected?
ABR Holdings' (SGX:533) stock is up by 9.3% over the past three months. However, its weak financial performance indicators makes us a bit doubtful if that trend could continue. In this article, we decided to focus on ABR Holdings' ROE.
ROE or return on equity is a useful tool to assess how effectively a company can generate returns on the investment it received from its shareholders. Simply put, it is used to assess the profitability of a company in relation to its equity capital.
Check out our latest analysis for ABR Holdings
How Is ROE Calculated?
The formula for return on equity is:
Return on Equity = Net Profit (from continuing operations) ÷ Shareholders' Equity
So, based on the above formula, the ROE for ABR Holdings is:
2.6% = S$2.5m ÷ S$97m (Based on the trailing twelve months to December 2022).
The 'return' is the amount earned after tax over the last twelve months. One way to conceptualize this is that for each SGD1 of shareholders' capital it has, the company made SGD0.03 in profit.
Why Is ROE Important For Earnings Growth?
We have already established that ROE serves as an efficient profit-generating gauge for a company's future earnings. Based on how much of its profits the company chooses to reinvest or "retain", we are then able to evaluate a company's future ability to generate profits. Generally speaking, other things being equal, firms with a high return on equity and profit retention, have a higher growth rate than firms that don’t share these attributes.
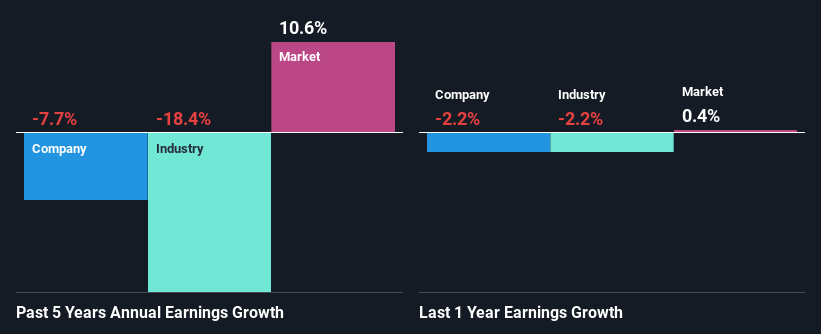
A Side By Side comparison of ABR Holdings' Earnings Growth And 2.6% ROE
As you can see, ABR Holdings' ROE looks pretty weak. Even when compared to the industry average of 3.9%, the ROE figure is pretty disappointing. Therefore, it might not be wrong to say that the five year net income decline of 7.7% seen by ABR Holdings was possibly a result of it having a lower ROE. However, there could also be other factors causing the earnings to decline. For example, the business has allocated capital poorly, or that the company has a very high payout ratio.
Next, we compared ABR Holdings' performance against the industry and found that the industry shrunk its earnings at 18% in the same period, which suggests that the company's earnings have been shrinking at a slower rate than its industry, This does offer shareholders some relief
Earnings growth is a huge factor in stock valuation. The investor should try to establish if the expected growth or decline in earnings, whichever the case may be, is priced in. By doing so, they will have an idea if the stock is headed into clear blue waters or if swampy waters await. Is ABR Holdings fairly valued compared to other companies? These 3 valuation measures might help you decide.
Is ABR Holdings Making Efficient Use Of Its Profits?
ABR Holdings has a high three-year median payout ratio of 82% (that is, it is retaining 18% of its profits). This suggests that the company is paying most of its profits as dividends to its shareholders. This goes some way in explaining why its earnings have been shrinking. With only very little left to reinvest into the business, growth in earnings is far from likely. You can see the 3 risks we have identified for ABR Holdings by visiting our risks dashboard for free on our platform here.
Moreover, ABR Holdings has been paying dividends for at least ten years or more suggesting that management must have perceived that the shareholders prefer dividends over earnings growth.
Summary
On the whole, ABR Holdings' performance is quite a big let-down. The company has seen a lack of earnings growth as a result of retaining very little profits and whatever little it does retain, is being reinvested at a very low rate of return. Until now, we have only just grazed the surface of the company's past performance by looking at the company's fundamentals. You can do your own research on ABR Holdings and see how it has performed in the past by looking at this FREE detailed graph of past earnings, revenue and cash flows.
Have feedback on this article? Concerned about the content? Get in touch with us directly. Alternatively, email editorial-team (at) simplywallst.com.
This article by Simply Wall St is general in nature. We provide commentary based on historical data and analyst forecasts only using an unbiased methodology and our articles are not intended to be financial advice. It does not constitute a recommendation to buy or sell any stock, and does not take account of your objectives, or your financial situation. We aim to bring you long-term focused analysis driven by fundamental data. Note that our analysis may not factor in the latest price-sensitive company announcements or qualitative material. Simply Wall St has no position in any stocks mentioned.
Join A Paid User Research Session
You’ll receive a US$30 Amazon Gift card for 1 hour of your time while helping us build better investing tools for the individual investors like yourself. Sign up here
