Medinex Limited's (Catalist:OTX) Stock Price Has Stayed Flat But Financial Prospects Look Decent: Can The Market Catch Up?
It is easy to overlook Medinex's (Catalist:OTX) given its unimpressive and roughly flat price performance over the past week. However, the company's key financials probably have more to say so you may want to give the company a closer look given that stock prices usually follow the long-term financial performance of a business. Specifically, we decided to study Medinex's ROE in this article.
Return on Equity or ROE is a test of how effectively a company is growing its value and managing investors’ money. Simply put, it is used to assess the profitability of a company in relation to its equity capital.
Check out our latest analysis for Medinex
How Is ROE Calculated?
ROE can be calculated by using the formula:
Return on Equity = Net Profit (from continuing operations) ÷ Shareholders' Equity
So, based on the above formula, the ROE for Medinex is:
8.6% = S$1.5m ÷ S$18m (Based on the trailing twelve months to September 2022).
The 'return' is the income the business earned over the last year. So, this means that for every SGD1 of its shareholder's investments, the company generates a profit of SGD0.09.
Why Is ROE Important For Earnings Growth?
So far, we've learned that ROE is a measure of a company's profitability. Depending on how much of these profits the company reinvests or "retains", and how effectively it does so, we are then able to assess a company’s earnings growth potential. Assuming all else is equal, companies that have both a higher return on equity and higher profit retention are usually the ones that have a higher growth rate when compared to companies that don't have the same features.
A Side By Side comparison of Medinex's Earnings Growth And 8.6% ROE
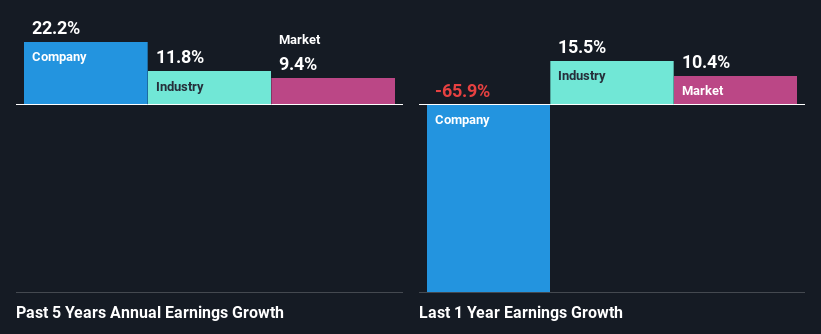
At first glance, Medinex's ROE doesn't look very promising. Next, when compared to the average industry ROE of 11%, the company's ROE leaves us feeling even less enthusiastic. Despite this, surprisingly, Medinex saw an exceptional 22% net income growth over the past five years. We reckon that there could be other factors at play here. For example, it is possible that the company's management has made some good strategic decisions, or that the company has a low payout ratio.
We then compared Medinex's net income growth with the industry and we're pleased to see that the company's growth figure is higher when compared with the industry which has a growth rate of 12% in the same period.
Earnings growth is an important metric to consider when valuing a stock. What investors need to determine next is if the expected earnings growth, or the lack of it, is already built into the share price. By doing so, they will have an idea if the stock is headed into clear blue waters or if swampy waters await. One good indicator of expected earnings growth is the P/E ratio which determines the price the market is willing to pay for a stock based on its earnings prospects. So, you may want to check if Medinex is trading on a high P/E or a low P/E, relative to its industry.
Is Medinex Efficiently Re-investing Its Profits?
Medinex has a significant three-year median payout ratio of 63%, meaning the company only retains 37% of its income. This implies that the company has been able to achieve high earnings growth despite returning most of its profits to shareholders.
Additionally, Medinex has paid dividends over a period of four years which means that the company is pretty serious about sharing its profits with shareholders.
Conclusion
On the whole, we do feel that Medinex has some positive attributes. That is, quite an impressive growth in earnings. However, the low profit retention means that the company's earnings growth could have been higher, had it been reinvesting a higher portion of its profits. Up till now, we've only made a short study of the company's growth data. So it may be worth checking this free detailed graph of Medinex's past earnings, as well as revenue and cash flows to get a deeper insight into the company's performance.
Have feedback on this article? Concerned about the content? Get in touch with us directly. Alternatively, email editorial-team (at) simplywallst.com.
This article by Simply Wall St is general in nature. We provide commentary based on historical data and analyst forecasts only using an unbiased methodology and our articles are not intended to be financial advice. It does not constitute a recommendation to buy or sell any stock, and does not take account of your objectives, or your financial situation. We aim to bring you long-term focused analysis driven by fundamental data. Note that our analysis may not factor in the latest price-sensitive company announcements or qualitative material. Simply Wall St has no position in any stocks mentioned.
Join A Paid User Research Session
You’ll receive a US$30 Amazon Gift card for 1 hour of your time while helping us build better investing tools for the individual investors like yourself. Sign up here
