
 Yahoo Finance
 Hai Leck Holdings Limited (SGX:BLH) Stock's On A Decline: Are Poor Fundamentals The Cause?
With its stock down 2.2% over the past three months, it is easy to disregard Hai Leck Holdings (SGX:BLH). Given that stock prices are usually driven by a company’s fundamentals over the long term, which in this case look pretty weak, we decided to study the company's key financial indicators. Particularly, we will be paying attention to Hai Leck Holdings' ROE today.
Return on Equity or ROE is a test of how effectively a company is growing its value and managing investors’ money. In short, ROE shows the profit each dollar generates with respect to its shareholder investments.
View our latest analysis for Hai Leck Holdings
How Do You Calculate Return On Equity?
The formula for ROE is:
Return on Equity = Net Profit (from continuing operations) ÷ Shareholders' Equity
So, based on the above formula, the ROE for Hai Leck Holdings is:
6.1% = S$7.0m ÷ S$114m (Based on the trailing twelve months to September 2022).
The 'return' is the profit over the last twelve months. One way to conceptualize this is that for each SGD1 of shareholders' capital it has, the company made SGD0.06 in profit.
What Is The Relationship Between ROE And Earnings Growth?
We have already established that ROE serves as an efficient profit-generating gauge for a company's future earnings. We now need to evaluate how much profit the company reinvests or "retains" for future growth which then gives us an idea about the growth potential of the company. Generally speaking, other things being equal, firms with a high return on equity and profit retention, have a higher growth rate than firms that don’t share these attributes.
A Side By Side comparison of Hai Leck Holdings' Earnings Growth And 6.1% ROE
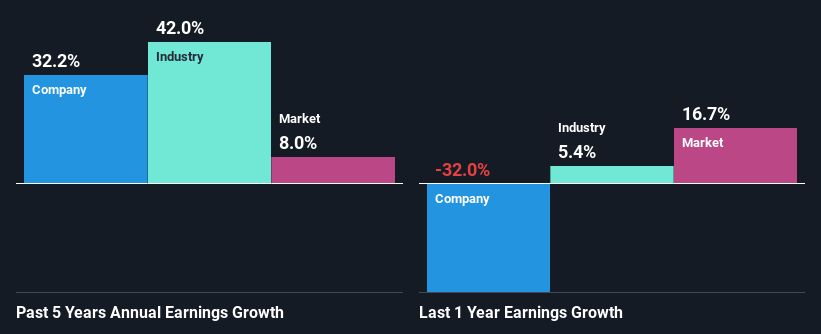
When you first look at it, Hai Leck Holdings' ROE doesn't look that attractive. Next, when compared to the average industry ROE of 8.1%, the company's ROE leaves us feeling even less enthusiastic. In spite of this, Hai Leck Holdings was able to grow its net income considerably, at a rate of 32% in the last five years. We reckon that there could be other factors at play here. Such as - high earnings retention or an efficient management in place.
As a next step, we compared Hai Leck Holdings' net income growth with the industry and were disappointed to see that the company's growth is lower than the industry average growth of 42% in the same period.
Earnings growth is a huge factor in stock valuation. The investor should try to establish if the expected growth or decline in earnings, whichever the case may be, is priced in. Doing so will help them establish if the stock's future looks promising or ominous. If you're wondering about Hai Leck Holdings''s valuation, check out this gauge of its price-to-earnings ratio, as compared to its industry.
Is Hai Leck Holdings Efficiently Re-investing Its Profits?
Hai Leck Holdings has a significant three-year median payout ratio of 91%, meaning the company only retains 8.9% of its income. This implies that the company has been able to achieve high earnings growth despite returning most of its profits to shareholders.
Additionally, Hai Leck Holdings has paid dividends over a period of nine years which means that the company is pretty serious about sharing its profits with shareholders.
Summary
On the whole, Hai Leck Holdings' performance is quite a big let-down. While no doubt its earnings growth is pretty respectable, its ROE and earnings retention is quite poor. So while the company has managed to grow its earnings in spite of this, we are unconvinced if this growth could extend, specially during troubled times. Up till now, we've only made a short study of the company's growth data. You can do your own research on Hai Leck Holdings and see how it has performed in the past by looking at this FREE detailed graph of past earnings, revenue and cash flows.
Have feedback on this article? Concerned about the content? Get in touch with us directly. Alternatively, email editorial-team (at) simplywallst.com.
This article by Simply Wall St is general in nature. We provide commentary based on historical data and analyst forecasts only using an unbiased methodology and our articles are not intended to be financial advice. It does not constitute a recommendation to buy or sell any stock, and does not take account of your objectives, or your financial situation. We aim to bring you long-term focused analysis driven by fundamental data. Note that our analysis may not factor in the latest price-sensitive company announcements or qualitative material. Simply Wall St has no position in any stocks mentioned.
Join A Paid User Research Session
You’ll receive a US$30 Amazon Gift card for 1 hour of your time while helping us build better investing tools for the individual investors like yourself. Sign up here
