
 Yahoo Finance
 Some Investors May Be Worried About AVJennings' (ASX:AVJ) Returns On Capital
What financial metrics can indicate to us that a company is maturing or even in decline? Businesses in decline often have two underlying trends, firstly, a declining return on capital employed (ROCE) and a declining base of capital employed. Ultimately this means that the company is earning less per dollar invested and on top of that, it's shrinking its base of capital employed. So after we looked into AVJennings (ASX:AVJ), the trends above didn't look too great.
Return On Capital Employed (ROCE): What Is It?
If you haven't worked with ROCE before, it measures the 'return' (pre-tax profit) a company generates from capital employed in its business. Analysts use this formula to calculate it for AVJennings:
Return on Capital Employed = Earnings Before Interest and Tax (EBIT) ÷ (Total Assets - Current Liabilities)
0.024 = AU$15m ÷ (AU$730m - AU$102m) (Based on the trailing twelve months to June 2022).
Therefore, AVJennings has an ROCE of 2.4%. In absolute terms, that's a low return and it also under-performs the Consumer Durables industry average of 9.1%.
View our latest analysis for AVJennings
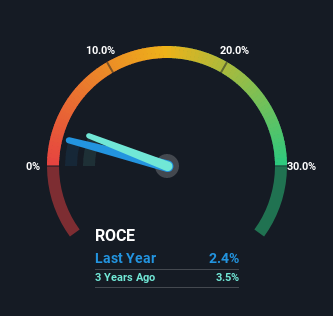
Historical performance is a great place to start when researching a stock so above you can see the gauge for AVJennings' ROCE against it's prior returns. If you're interested in investigating AVJennings' past further, check out this free graph of past earnings, revenue and cash flow.
So How Is AVJennings' ROCE Trending?
There is reason to be cautious about AVJennings, given the returns are trending downwards. About five years ago, returns on capital were 7.4%, however they're now substantially lower than that as we saw above. On top of that, it's worth noting that the amount of capital employed within the business has remained relatively steady. Since returns are falling and the business has the same amount of assets employed, this can suggest it's a mature business that hasn't had much growth in the last five years. If these trends continue, we wouldn't expect AVJennings to turn into a multi-bagger.
The Bottom Line
In summary, it's unfortunate that AVJennings is generating lower returns from the same amount of capital. It should come as no surprise then that the stock has fallen 30% over the last five years, so it looks like investors are recognizing these changes. Unless there is a shift to a more positive trajectory in these metrics, we would look elsewhere.
Since virtually every company faces some risks, it's worth knowing what they are, and we've spotted 2 warning signs for AVJennings (of which 1 shouldn't be ignored!) that you should know about.
For those who like to invest in solid companies, check out this free list of companies with solid balance sheets and high returns on equity.
Have feedback on this article? Concerned about the content? Get in touch with us directly. Alternatively, email editorial-team (at) simplywallst.com.
This article by Simply Wall St is general in nature. We provide commentary based on historical data and analyst forecasts only using an unbiased methodology and our articles are not intended to be financial advice. It does not constitute a recommendation to buy or sell any stock, and does not take account of your objectives, or your financial situation. We aim to bring you long-term focused analysis driven by fundamental data. Note that our analysis may not factor in the latest price-sensitive company announcements or qualitative material. Simply Wall St has no position in any stocks mentioned.
Join A Paid User Research Session
You’ll receive a US$30 Amazon Gift card for 1 hour of your time while helping us build better investing tools for the individual investors like yourself. Sign up here
