
Fujian Dongbai (Group)Ltd (SHSE:600693) Stock Falls 10% in Past Week as Five-year Earnings and Shareholder Returns Continue Downward Trend
Fujian Dongbai (Group)Ltd (SHSE:600693) Stock Falls 10% in Past Week as Five-year Earnings and Shareholder Returns Continue Downward Trend
In order to justify the effort of selecting individual stocks, it's worth striving to beat the returns from a market index fund. But the main game is to find enough winners to more than offset the losers At this point some shareholders may be questioning their investment in Fujian Dongbai (Group) Co.,Ltd. (SHSE:600693), since the last five years saw the share price fall 50%. Unfortunately the share price momentum is still quite negative, with prices down 15% in thirty days.
為了證明選擇單個股票的努力,值得努力擊敗市場指數基金的回報。但是遊戲主要是找到足夠的贏家來抵消失敗者在這一點上,一些股東可能會質疑他們的投資 福建東柏(集團)股份有限公司, 有限公司 股票代號:600693),自過去五年以來,股價下跌了 50%。不幸的是,股價勢頭仍然是相當負面的,價格在 30 天內下降了 15%。
With the stock having lost 10% in the past week, it's worth taking a look at business performance and seeing if there's any red flags.
由於股票在過去一周損失了 10%,因此值得一看業務表現並查看是否有任何紅旗。
View our latest analysis for Fujian Dongbai (Group)Ltd
查看我們對福建東柏(集團)有限公司的最新分析
There is no denying that markets are sometimes efficient, but prices do not always reflect underlying business performance. One flawed but reasonable way to assess how sentiment around a company has changed is to compare the earnings per share (EPS) with the share price.
無可否認,市場有時是有效的,但價格並不總是反映基礎的業務表現。評估公司周圍情緒如何變化的一個有缺陷但合理的方法是將每股盈利(EPS)與股價進行比較。
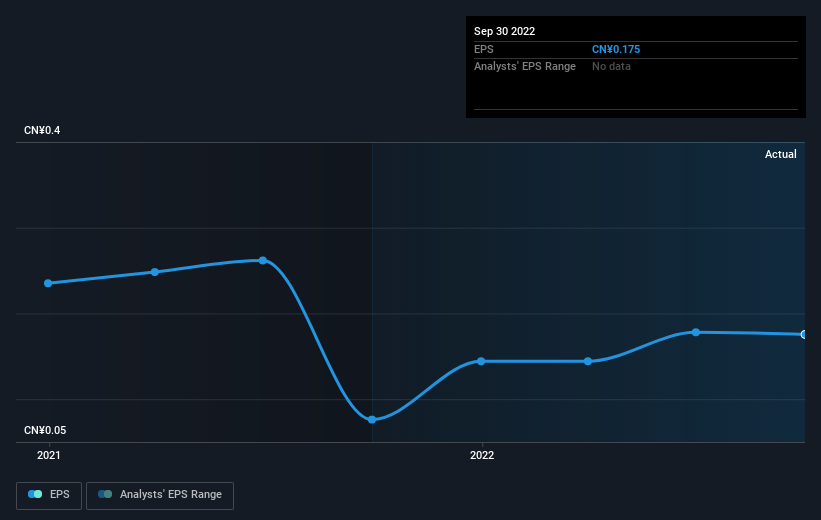
Looking back five years, both Fujian Dongbai (Group)Ltd's share price and EPS declined; the latter at a rate of 7.4% per year. Readers should note that the share price has fallen faster than the EPS, at a rate of 13% per year, over the period. This implies that the market is more cautious about the business these days.
回顧五年,福建東柏(集團)有限公司的股價和每股盈利均下跌,後者每年的利率為 7.4%。讀者應注意,在此期間,股價下跌速度超過每股盈餘,每年 13% 的速度下跌。這意味著市場對這些天的業務更加謹慎。
You can see below how EPS has changed over time (discover the exact values by clicking on the image).
您可以在下面看到 EPS 隨時間變化的情況(通過單擊圖像以查找確切值)。
It might be well worthwhile taking a look at our free report on Fujian Dongbai (Group)Ltd's earnings, revenue and cash flow.
這可能是非常值得看看我們的 自由 福建東柏(集團)有限公司的盈利、收入及現金流量報告。
A Different Perspective
不同的角度
It's good to see that Fujian Dongbai (Group)Ltd has rewarded shareholders with a total shareholder return of 7.8% in the last twelve months. There's no doubt those recent returns are much better than the TSR loss of 8% per year over five years. The long term loss makes us cautious, but the short term TSR gain certainly hints at a brighter future. It's always interesting to track share price performance over the longer term. But to understand Fujian Dongbai (Group)Ltd better, we need to consider many other factors. Case in point: We've spotted 4 warning signs for Fujian Dongbai (Group)Ltd you should be aware of, and 2 of them are a bit unpleasant.
很高興看到福建東柏(集團)有限公司在過去十二個月內向股東獎勵了 7.8% 的總股東回報率。毫無疑問,最近的回報比五年來每年的 TSR 損失 8% 要好得多。長期損失使我們保持謹慎,但短期 TSR 收益肯定暗示著更光明的未來。跟踪長期的股價表現總是很有趣。但是要更好地了解福建東柏(集團)有限公司,我們還需要考慮很多其他因素。例子點:我們已經發現 福建東柏(集團)有限公司的 4 個警告標誌 你應該知道,其中 2 個有點不愉快。
For those who like to find winning investments this free list of growing companies with recent insider purchasing, could be just the ticket.
對於那些喜歡找到的人 贏得投資 這個 自由 與最近的內部人員購買成長公司的名單,可能只是票。
Please note, the market returns quoted in this article reflect the market weighted average returns of stocks that currently trade on CN exchanges.
請注意,本文中引用的市場回報反映了當前在 CN 交易所交易的股票的市場加權平均回報率。
Have feedback on this article? Concerned about the content? Get in touch with us directly. Alternatively, email editorial-team (at) simplywallst.com.
This article by Simply Wall St is general in nature. We provide commentary based on historical data and analyst forecasts only using an unbiased methodology and our articles are not intended to be financial advice. It does not constitute a recommendation to buy or sell any stock, and does not take account of your objectives, or your financial situation. We aim to bring you long-term focused analysis driven by fundamental data. Note that our analysis may not factor in the latest price-sensitive company announcements or qualitative material. Simply Wall St has no position in any stocks mentioned.
對這篇文章有反饋嗎?關注內容? 取得聯繫 直接與我們聯繫。 或者,通過電子郵件發送電子郵件給編輯團隊。
這篇文章由簡單牆聖是一般性質. 我們僅使用公正的方法,根據歷史數據和分析師預測提供評論,我們的文章並不打算作為財務建議。 它並不構成購買或出售任何股票的建議,也不會考慮您的目標或您的財務狀況。我們的目標是為您帶來由基本數據驅動的長期集中分析。請注意,我們的分析可能不會考慮最新的價格敏感公司公告或定性材料。簡易華街在提及的任何股票中都沒有倉位。
譯文內容由第三人軟體翻譯。