
Hoshine Silicon Industry's (SHSE:603260) Earnings Growth Rate Lags the 43% CAGR Delivered to Shareholders
Hoshine Silicon Industry's (SHSE:603260) Earnings Growth Rate Lags the 43% CAGR Delivered to Shareholders
While Hoshine Silicon Industry Co., Ltd. (SHSE:603260) shareholders are probably generally happy, the stock hasn't had particularly good run recently, with the share price falling 29% in the last quarter. In contrast, the return over three years has been impressive. Indeed, the share price is up a very strong 184% in that time. After a run like that some may not be surprised to see prices moderate. The thing to consider is whether the underlying business is doing well enough to support the current price.
Although Hoshine Silicon Industry has shed CN¥12b from its market cap this week, let's take a look at its longer term fundamental trends and see if they've driven returns.
Check out our latest analysis for Hoshine Silicon Industry
To quote Buffett, 'Ships will sail around the world but the Flat Earth Society will flourish. There will continue to be wide discrepancies between price and value in the marketplace...' One imperfect but simple way to consider how the market perception of a company has shifted is to compare the change in the earnings per share (EPS) with the share price movement.
Hoshine Silicon Industry was able to grow its EPS at 68% per year over three years, sending the share price higher. This EPS growth is higher than the 42% average annual increase in the share price. So it seems investors have become more cautious about the company, over time. We'd venture the lowish P/E ratio of 11.60 also reflects the negative sentiment around the stock.
You can see below how EPS has changed over time (discover the exact values by clicking on the image).
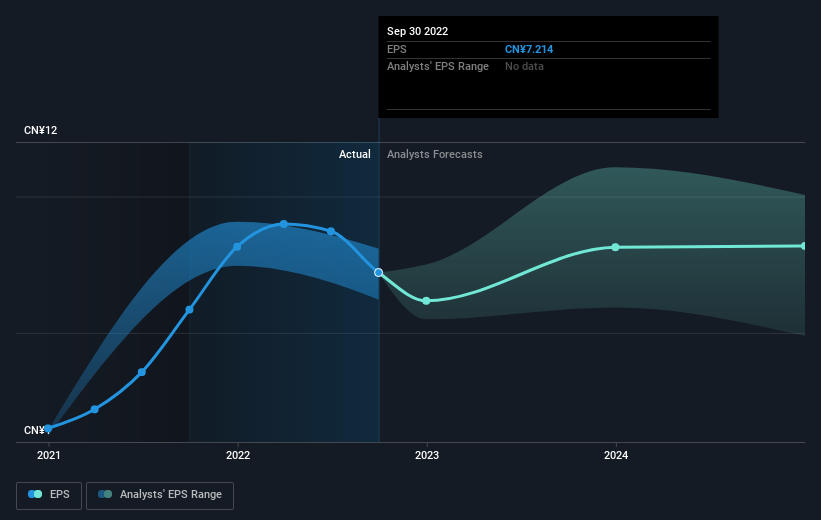 SHSE:603260 Earnings Per Share Growth December 23rd 2022
We're pleased to report that the CEO is remunerated more modestly than most CEOs at similarly capitalized companies. But while CEO remuneration is always worth checking, the really important question is whether the company can grow earnings going forward. Dive deeper into the earnings by checking this interactive graph of Hoshine Silicon Industry's earnings, revenue and cash flow.
What About Dividends?
It is important to consider the total shareholder return, as well as the share price return, for any given stock. The TSR incorporates the value of any spin-offs or discounted capital raisings, along with any dividends, based on the assumption that the dividends are reinvested. It's fair to say that the TSR gives a more complete picture for stocks that pay a dividend. In the case of Hoshine Silicon Industry, it has a TSR of 193% for the last 3 years. That exceeds its share price return that we previously mentioned. The dividends paid by the company have thusly boosted the total shareholder return.
A Different Perspective
We regret to report that Hoshine Silicon Industry shareholders are down 36% for the year (even including dividends). Unfortunately, that's worse than the broader market decline of 20%. However, it could simply be that the share price has been impacted by broader market jitters. It might be worth keeping an eye on the fundamentals, in case there's a good opportunity. Longer term investors wouldn't be so upset, since they would have made 16%, each year, over five years. It could be that the recent sell-off is an opportunity, so it may be worth checking the fundamental data for signs of a long term growth trend. It's always interesting to track share price performance over the longer term. But to understand Hoshine Silicon Industry better, we need to consider many other factors. Consider for instance, the ever-present spectre of investment risk. We've identified 2 warning signs with Hoshine Silicon Industry (at least 1 which makes us a bit uncomfortable) , and understanding them should be part of your investment process.
If you like to buy stocks alongside management, then you might just love this free list of companies. (Hint: insiders have been buying them).
Please note, the market returns quoted in this article reflect the market weighted average returns of stocks that currently trade on CN exchanges.
Have feedback on this article? Concerned about the content? Get in touch with us directly. Alternatively, email editorial-team (at) simplywallst.com.
This article by Simply Wall St is general in nature. We provide commentary based on historical data and analyst forecasts only using an unbiased methodology and our articles are not intended to be financial advice. It does not constitute a recommendation to buy or sell any stock, and does not take account of your objectives, or your financial situation. We aim to bring you long-term focused analysis driven by fundamental data. Note that our analysis may not factor in the latest price-sensitive company announcements or qualitative material. Simply Wall St has no position in any stocks mentioned.
而當和尚硅業有限公司。(上海證券交易所:603260)股東可能總體上很滿意,該股最近表現不是特別好,上個季度股價下跌了29%。相比之下,三年來的回報令人印象深刻。事實上,在這段時間裏,該公司股價強勁上漲了184%。在經歷了這樣的漲勢後,一些人可能不會對價格放緩感到驚訝。需要考慮的是,基礎業務的表現是否足以支撐當前的價格。
儘管荷光硅業本週市值縮水120億元,但讓我們來看看其較長期的基本面趨勢,看看它們是否推動了回報。
查看我們最新的對荷光硅行業的分析
用巴菲特的話説,“船隻將在世界各地航行,但平坦的地球協會將蓬勃發展。市場上的價格和價值之間將繼續存在巨大的差異……”一種不完美但簡單的方法來考慮市場對一家公司的看法是如何改變的,那就是將每股收益(EPS)的變化與股價走勢進行比較。
在三年的時間裏,霍肖恩硅業能夠以每年68%的速度增長每股收益,推動了股價的上漲。這一每股收益增幅高於該公司股價42%的年均增幅。因此,隨着時間的推移,投資者似乎對該公司變得更加謹慎了。我們敢打賭,11.60的低市盈率也反映了圍繞該股的負面情緒。
您可以在下面看到EPS是如何隨着時間的推移而變化的(通過單擊圖像來了解確切的值)。
上海證交所:2022年12月23日每股收益增長603260我們很高興地報告,這位首席執行官的薪酬比類似資本公司的大多數首席執行官都要低。但是,儘管CEO的薪酬總是值得檢查的,但真正重要的問題是,公司能否在未來實現收益增長。通過查看霍肖恩硅業的收益、收入和現金流的互動圖表,更深入地瞭解收益。
那股息呢?
重要的是要考慮任何給定股票的總股東回報以及股價回報。TSR包括任何剝離或貼現融資的價值,以及任何股息,基於股息再投資的假設。公平地説,TSR為支付股息的股票提供了更完整的圖景。以和光硅業為例,它在過去3年的總資產收益率為193%。這超過了我們之前提到的它的股價回報。該公司支付的股息因此提振了總計股東回報。
不同的視角
我們遺憾地報告,荷光硅業的股東今年以來下降了36%(甚至包括股息)。不幸的是,這比大盤20%的跌幅還要糟糕。然而,這可能只是因為股價受到了更廣泛的市場緊張情緒的影響。也許有必要關注基本面,以防出現良機。長期投資者不會如此沮喪,因為他們在五年內每年會獲得16%的收益。最近的拋售可能是一個機會,因此可能值得查看基本面數據,以尋找長期增長趨勢的跡象。跟蹤股價的長期表現總是很有趣的。但是,為了更好地理解霍肖恩硅業,我們需要考慮許多其他因素。例如,考慮一下無處不在的投資風險幽靈。我們已經確定了兩個警告信號與霍肖恩硅業(至少1家,這讓我們有點不舒服),瞭解他們應該是你投資過程的一部分。
如果你喜歡和管理層一起買股票,那麼你可能會喜歡這本書免費公司名單。(提示:內部人士一直在買入這些股票)。
請注意,本文引用的市場回報反映了目前在CN交易所交易的股票的市場加權平均回報。
對這篇文章有什麼反饋嗎?擔心內容嗎? 保持聯繫直接與我們聯繫。或者,也可以給編輯組發電子郵件,地址是implywallst.com。
本文由Simply Wall St.撰寫,具有概括性。我們僅使用不偏不倚的方法提供基於歷史數據和分析師預測的評論,我們的文章並不打算作為財務建議。它不構成買賣任何股票的建議,也沒有考慮你的目標或你的財務狀況。我們的目標是為您帶來由基本面數據驅動的長期重點分析。請注意,我們的分析可能不會將最新的對價格敏感的公司公告或定性材料考慮在內。Simply Wall St.對上述任何一隻股票都沒有持倉。
譯文內容由第三人軟體翻譯。
風險及免責聲明
- 分享到weixin
- 分享到qq
- 分享到facebook
- 分享到twitter
- 分享到微博
- 粘贴板
使用瀏覽器的分享功能,分享給你的好友吧