
 Yahoo Finance
 Should You Be Excited About Kencana Agri Limited's (SGX:BNE) 31% Return On Equity?
Many investors are still learning about the various metrics that can be useful when analysing a stock. This article is for those who would like to learn about Return On Equity (ROE). We'll use ROE to examine Kencana Agri Limited (SGX:BNE), by way of a worked example.
Return on equity or ROE is an important factor to be considered by a shareholder because it tells them how effectively their capital is being reinvested. In other words, it is a profitability ratio which measures the rate of return on the capital provided by the company's shareholders.
View our latest analysis for Kencana Agri
How Is ROE Calculated?
ROE can be calculated by using the formula:
Return on Equity = Net Profit (from continuing operations) ÷ Shareholders' Equity
So, based on the above formula, the ROE for Kencana Agri is:
31% = US$10m ÷ US$33m (Based on the trailing twelve months to June 2022).
The 'return' is the yearly profit. So, this means that for every SGD1 of its shareholder's investments, the company generates a profit of SGD0.31.
Does Kencana Agri Have A Good Return On Equity?
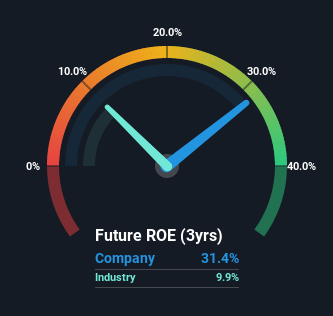
By comparing a company's ROE with its industry average, we can get a quick measure of how good it is. However, this method is only useful as a rough check, because companies do differ quite a bit within the same industry classification. Pleasingly, Kencana Agri has a superior ROE than the average (9.9%) in the Food industry.
That's clearly a positive. With that said, a high ROE doesn't always indicate high profitability. Aside from changes in net income, a high ROE can also be the outcome of high debt relative to equity, which indicates risk. Our risks dashboardshould have the 4 risks we have identified for Kencana Agri.
How Does Debt Impact Return On Equity?
Companies usually need to invest money to grow their profits. The cash for investment can come from prior year profits (retained earnings), issuing new shares, or borrowing. In the first two cases, the ROE will capture this use of capital to grow. In the latter case, the use of debt will improve the returns, but will not change the equity. In this manner the use of debt will boost ROE, even though the core economics of the business stay the same.
Kencana Agri's Debt And Its 31% ROE
It appears that Kencana Agri makes extensive use of debt to improve its returns, because it has an alarmingly high debt to equity ratio of 6.58. So although the company has an impressive ROE, the company might not have been able to achieve this without the significant use of debt.
Conclusion
Return on equity is useful for comparing the quality of different businesses. In our books, the highest quality companies have high return on equity, despite low debt. If two companies have the same ROE, then I would generally prefer the one with less debt.
But when a business is high quality, the market often bids it up to a price that reflects this. The rate at which profits are likely to grow, relative to the expectations of profit growth reflected in the current price, must be considered, too. So I think it may be worth checking this free this detailed graph of past earnings, revenue and cash flow.
If you would prefer check out another company -- one with potentially superior financials -- then do not miss this free list of interesting companies, that have HIGH return on equity and low debt.
Have feedback on this article? Concerned about the content? Get in touch with us directly. Alternatively, email editorial-team (at) simplywallst.com.
This article by Simply Wall St is general in nature. We provide commentary based on historical data and analyst forecasts only using an unbiased methodology and our articles are not intended to be financial advice. It does not constitute a recommendation to buy or sell any stock, and does not take account of your objectives, or your financial situation. We aim to bring you long-term focused analysis driven by fundamental data. Note that our analysis may not factor in the latest price-sensitive company announcements or qualitative material. Simply Wall St has no position in any stocks mentioned.
Join A Paid User Research Session
You’ll receive a US$30 Amazon Gift card for 1 hour of your time while helping us build better investing tools for the individual investors like yourself. Sign up here
