
"short selling" should be a term familiar to many senior cattle friends. if you want to hear that you "pinch and figure it out", there should be many cattle friends who focus on short selling.
But. Bulls who focus on doing long should also pay attention to it-as a reverse operation, the change of short selling pool can also become a "trading weapon" for bulls.
"what exactly do you think of the short selling pool? "
"what is the instructive effect? ".

So today, if you want to smell Jun, come to popularize the science about the proportion of short selling transactions. You can pick up the bench and read it.
Due to the reason of shorting data sources, the charts of short selling of Hong Kong stocks and US stocks are slightly different. I would like to hear that you will introduce to you.

First of all, we need to sort out the concept of short selling:
Short selling is a common adoption in mature capital markets.Profit from falling share priceThe means of transaction--
That is, when shorting a specified security that can be shorted, first borrow the securities from others to sell them, and then buy the securities at a low price from the market and return them to the lender when the stock price falls, so as to earn the difference between the falling stock price.
As far as Hong Kong stocks are concerned, the proportion of Hong Kong stocks short selling to the total market turnover (short selling ratio) has moved up step by step since 2000, and in the past 2020The volume of short selling in Hong Kong stocks reached more than HK $4 billion, accounting for 9% of the total market turnover.。
On the other hand, stocks with large market capitalization, good liquidity and rich sources of securities are the most active in shorting. Take the current Hong Kong stock "king" and Tencent, who has the highest market capitalization, as an example, Tencent has been shorted as high as nearly HK $400 billion in the past 2020. It accounts for 16% of the total turnover of its short-selling securities.
As we all know, the higher the proportion of a stock that is bearish, it means that it is not favored by many investors in the market, because it represents a large number of people who think that its stock price will fall.The proportion of short selling in total market transactions (short selling ratio) is too high, which reflects extremely pessimistic market sentiment.
But! At this time, small marginal changes are also easy to cause stock price fluctuations, such as the failure to cash in short positions leads to a reversal of short sentiment, triggering some short positions to buy stocks, thus pushing the stock price up; further forcing more short positions to stop losses and share prices to rise further.
Therefore, the extreme value of short selling ratio often corresponds to the technical bottom of the market.Therefore, investors can often monitor the change of short selling ratio to make a technical analysis of a stock. In Futu Niuniu, we can also find the short selling ratio of a stock in this way (or take Tencent as an example).
PC side:
First enter Tencent's stock quotation interface, and then click "analyze" tab in the upper right corner.

Then drop down to the indicator section on the "interpretation" page, and you can see the scale chart of the short selling transaction of the stock.

Mobile end:
The specific operation is similar to that of the computer, and you can find it by opening the stock page, clicking "analyze" tab and then dropping down.


So, how should this scale chart of short selling be interpreted?
First of all, we need to know this formula, how this ratio is calculated:
Proportion of short selling of Hong Kong stocks = number of short selling shares / total number of shares traded
The high proportion of short selling, on the one hand, reflects that investors are bearish on the future stock price, on the other hand, because the short sellers need to buy stocks to close their positions in the later stage, it will also stimulate the stock price to rise in the future.
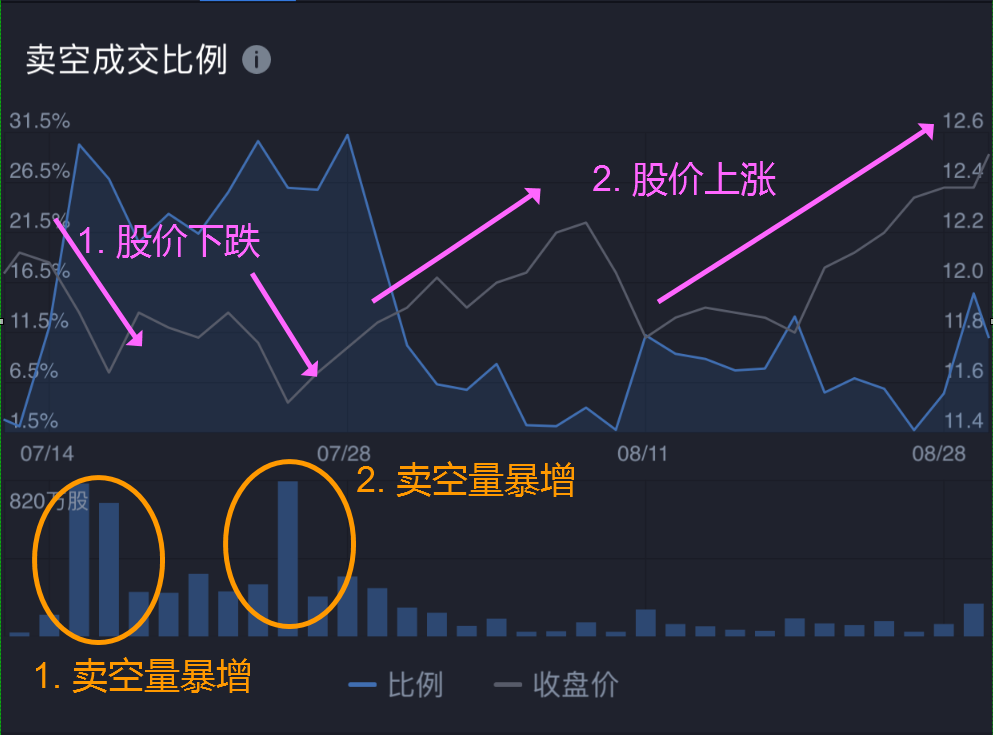
Well, according to the picture above, the stock had two sharp increases in short selling volume in mid-July and late July, respectively, with a high proportion of short selling transactions, corresponding to a decline in the share price of the day (the gray line is the closing price). Therefore, we can judge that the decline in stock prices is likely to be affected to some extent by the surge in the number of short sellers.
Again, the number of short sellers decreased significantly after the end of July, and stock prices rose. On the one hand, it may be due to high investor bullish sentiment and strong demand to buy stocks, which may lead to a rise in share prices; on the other hand, it may be because investors who have sold short in mid-and late July need to buy stocks to close their positions, which has led to an increase in demand for stocks in the market.
The chart of short selling ratio of US stocks is slightly different. The short selling ratio of US stocks = number of outstanding shares / number of outstanding shares.
It can be seen that the denominator of this formula is "number of open shares", which is different from the "number of short selling shares" of Hong Kong stocks. The term "number of open shares" refers to the part of the market that has been shorted and has not been covered or closed. Generally speaking, comparing the number of shares in this part with the total number of shares issued in the market, the proportion of short selling is formed, but in fact, the basic interpretation of the chart of US stocks is roughly the same as that of short selling of Hong Kong stocks:
The large number of open positions means that the current bears are depressing the stock price.
A sharp decrease in the number of open shares means that bears are buying stocks to close their positions, which will further stimulate the stock price to rise.
Let's use this picture to explain in detail:
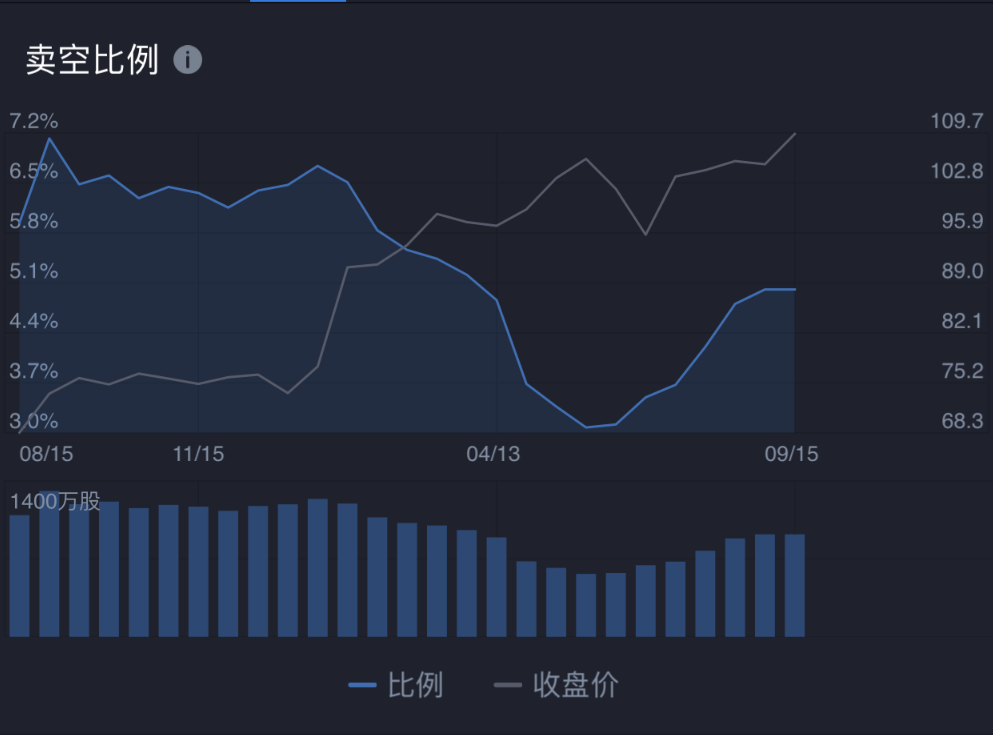
For most of the period before the chart, the stock price trend is completely negatively correlated with the number of open shares-the stock price is low if the short selling ratio is high, and the stock price is high if the short selling ratio is low.
However, it should also be noted that in the final stage of the chart, the proportion of short selling is high, but the stock price is also higher at the same time, which also shows that there are many factors that affect the stock price. We cannot judge the stock price trend only by relying on a certain index. The short selling scale chart is only one of the many factors that promote trading. There are many factors that affect the stock price. We must not make an one-sided trading decision based on a chart analysis.

Have you learned today's little knowledge?
Or do you have questions about other functions of Futuo Niuniu?
Remember to tell Wen Jun in the comments section and arrange it for you right away!