
 (来源:FXEmpire)
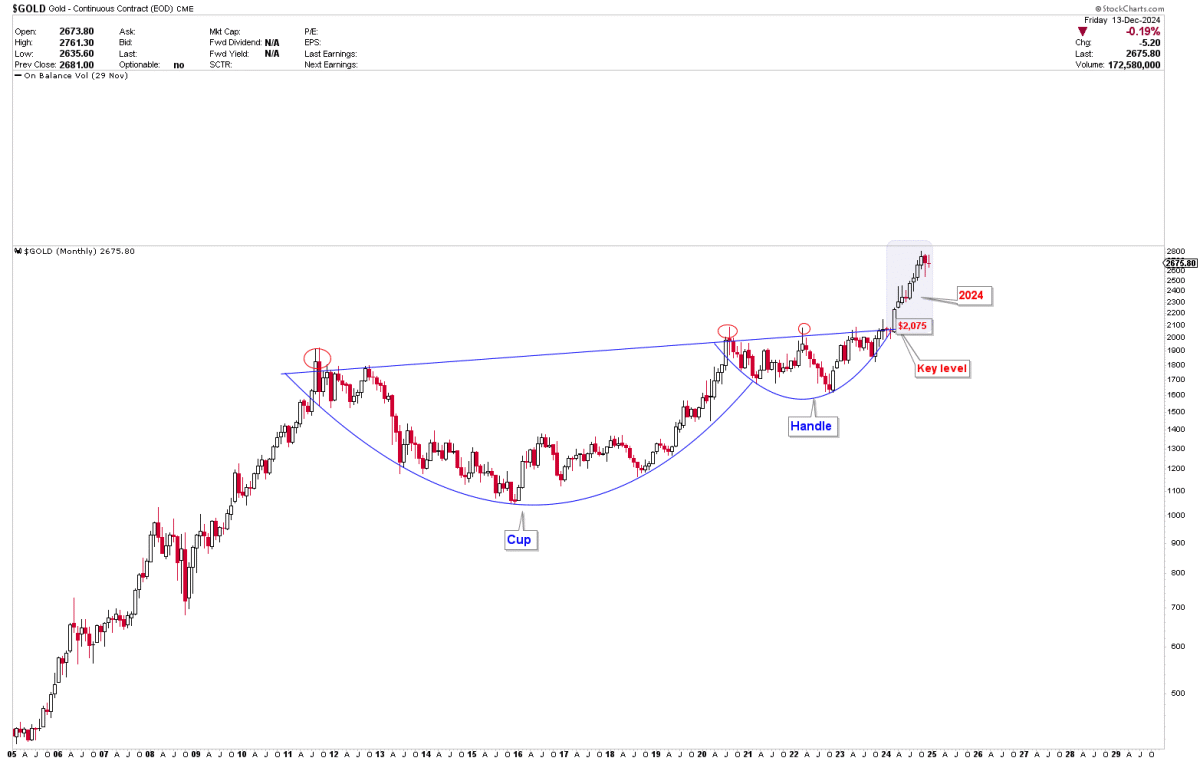
FXEmpire Analyst Muhammad Umair stated that Gold has formed a massive "cup and handle" technical pattern on the monthly chart, and the continued monthly increases have created a Call environment for the Gold market. Looking ahead to 2025, he believes the price of Gold will reach 3,000 USD, and the short-term adjustment in the first quarter (January-March) may provide strategic Buy opportunities.
Umair pointed out that the Gold monthly chart shows that from the peak in 2011 to the breakout in 2024, Gold has been forming a cup and handle pattern. The neck line of this pattern is at the critical level of 2,075 USD. A breakout above the 2,075 USD level will trigger a strong increase in 2024. The sustained monthly increases throughout 2024 have created a Call environment for the Gold market.
This Call environment lays the foundation for further upward momentum in the coming years, and after the broader cup and handle pattern is completed, this breakout indicates that prices may continue to rise steadily. Any price adjustments in 2025 are expected to be seen as Buy opportunities, supporting further upward movement in the Gold market.
 (Source: FXEmpire)
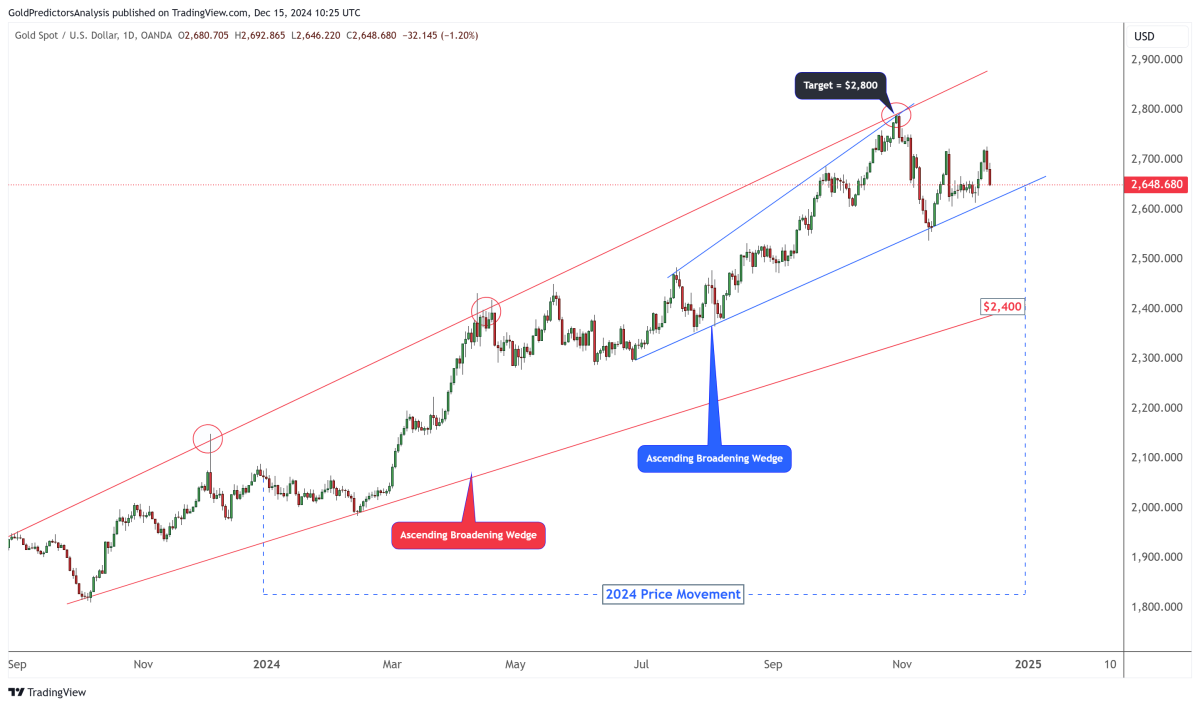
To better understand the bullish price trend in 2024, the daily Gold chart shows that prices have maintained an expanding ascending wedge pattern throughout the year. This wedge pattern began in the last quarter of 2023. This pattern drives prices toward the target area of 2,800 USD in 2024.
The chart also forms another expanding ascending wedge, highlighted in blue, which intersects with the red expanding wedge, creating a target area around 2,800 USD. After reaching this target area, the Gold market begins to correct, finding support within the blue expanding ascending wedge pattern. Prices start from 2,540 USD within the blue wedge.ResistanceThe rebound is rising. Since reaching the Target Price of $2800, prices have entered a correction phase, moving away from the target area.
(Source: FXEmpire)
A drop below $2540 could trigger further price pullbacks towards the $2400 area near the red upward expanding wedge.
The monthly Gold chart shows that since the bottom in 2015, the price has been trading within an expanding wedge pattern. The consolidation since the 2020 peak has formed an inverted head and shoulders pattern within this expanding wedge. The neckline of the inverted head and shoulders pattern aligns with the key level of $2075. This level is also a critical area for the cup and handle pattern on the monthly chart.
Breaking through this key level triggered a strong upward movement. The price corrections in May and June 2024 reached the Buy zone, pushing prices closer to the initial Target Price of $2800. However, prices are now pulling back to the second Buy signal within the upward expanding wedge pattern, located near the $2400 area.

(Source: FXEmpire)
If the Gold market experiences a significant decline in 2025, the maximum pullback may extend to the $2000 area. This price area is supported by the 38.2% Fibonacci retracement level calculated from the low in late 2015 to the historical high. If the price pullback extends to the $2000-2200 range, it will provide a long-term Buy opportunity, with a Target Price of over $3000.
On the other hand, breaking through the $2800 level will confirm the end of the correction and initiate the next rally, with a target of over $3000. This target aligns with the resistance line of the rising expanding wedge, which continues to extend upward.
The following chart shows that December and January are typically strong months for the Gold market. However, historically, February has been the weakest month for Gold performance over the past seven years. Given that Gold prices continue to rise throughout 2024, a strong December may also signal a positive January. However, as Gold prices approach the target area, a price peak may form in the first quarter of 2024. This peak could lead to a price pullback in early 2025, allowing the market to find a strong Resistance area. This pullback is likely to provide Buy opportunities for traders and investors.

(Source: FXEmpire)
Another chart shows that March and April are the best months for rising Gold prices. Therefore, if prices bottom out in early 2025, a strong rebound may occur in the second and third quarters of 2025.

(Source: FXEmpire)
Umair summarizes that the historical resilience of the Gold market continues to drive its Call trajectory, influenced by technical patterns, geopolitical tensions, and economic uncertainty. The breakthrough from key levels in 2024 lays the foundation for a possible rebound to the $3000 region. Central bank purchases and ongoing inflation concerns support this rebound.
He pointed out that a short-term adjustment in the first quarter of 2025 could provide Global Strategy buying opportunities for the second half of this year. The overall outlook remains optimistic, as geopolitical and economic factors may maintain the appeal of Gold. As 2024 approaches, traders and investors should closely monitor key Resistance and support levels to take advantage of emerging trends in the Gold market. The support range for 2025 spans from $2400 to $2000, with a Target Price above $3000.

