
 美国当选总统特朗普上周六在他的社交媒体平台Truth Social上写道,要求金砖国家使用美元作为储备货币,并威胁说,如果他们支持另一种货币来取代美元,将征收100%的关税。
#Gold Technical Analysis# 24K99 news On Monday (December 2nd), after the beginning of the trade session in Asia, the usd showed an uptrend, and spot gold has just experienced a short-term sharp decline, with the current gold price falling to around $2,625 per ounce, a daily drop of $25. Well-known financial website FXDailyReport analyst Nicholas Kitonyi wrote an analysis on the future trend of gold.
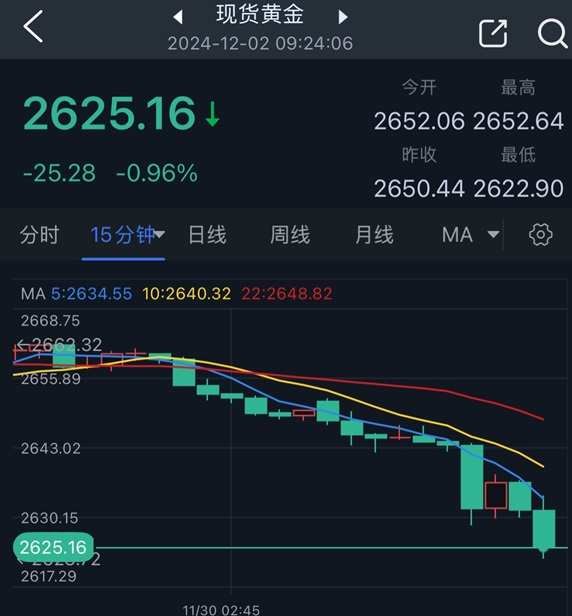
(Source: 24K99) 15-minute chart for spot gold.
The usd is currently at 106.21, up 0.4% for the day. Analysts point out that Trump's latest tariff threats are driving the usd stronger.
 The elected president of the usa, Trump, wrote on his social media platform Truth Social last Saturday, calling for BRICS nations to use the usd as a reserve currency and threatening to impose a 100% tariff if they support another currency to replace the usd.
Trump and his economic advisors are discussing how to punish allies and adversaries who attempt to conduct bilateral trade using a non-usd currency. Bloomberg reported that, according to insiders, these measures include considering export controls, currency manipulation allegations, and imposing tariffs on trade.
Gold also continued its downward trend from last week. Spot gold closed down sharply by $65.41 last week, a drop of 2.41%.
Two pictures of the technical prospects of gold
In terms of short-term trends, Kitonyi stated that from a technical perspective, based on the 60-minute chart, gold prices are trading within a slowly rising channel. However, the 14-hour relative strength index (RSI) has recently pulled back to avoid rebounding into overbought territory.
Therefore, from a short-term perspective, gold bears will look for gold prices to continue the current downward trend and fall to 2610 usd/ounce.
On the other hand, gold bulls will look to take profits when gold prices rebound to 2654 usd/ounce, or higher at 2669 usd/ounce.
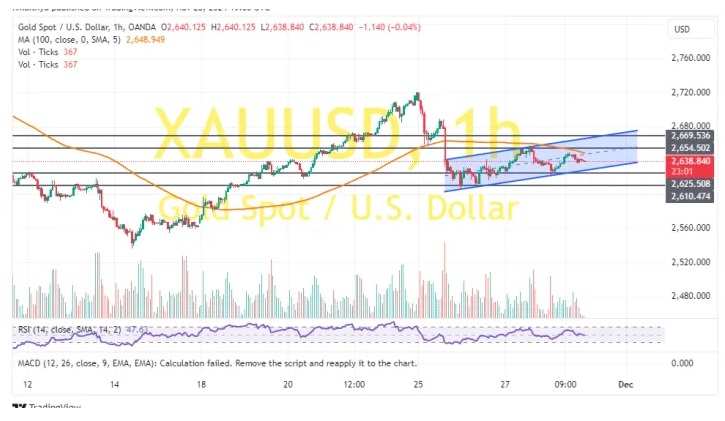
(Spot gold 60-minute chart source: FXDailyReport)
Kitonyi noted that on the daily chart, gold prices are about to form a head and shoulders pattern. The 14-day RSI has pulled back to avoid rebounding into overbought territory.
Therefore, from a medium to long-term perspective, gold bears will seek for gold prices to continue the downward trend and fall to 2561 usd/ounce, or lower at 2486 usd/ounce.
On the other hand, bulls will look to take profits when gold prices rebound to around 2720 usd/ounce, or higher at 2796 usd/ounce.

(Spot gold daily chart source: FXDailyReport)
As of 09:24 in Peking, spot gold is priced at 2625.16 usd per ounce.
