
Global Payments Inc. (NYSE:GPN) shareholders should be happy to see the share price up 17% in the last month. But that doesn't change the fact that the returns over the last five years have been less than pleasing. After all, the share price is down 32% in that time, significantly under-performing the market.
While the last five years has been tough for Global Payments shareholders, this past week has shown signs of promise. So let's look at the longer term fundamentals and see if they've been the driver of the negative returns.
To paraphrase Benjamin Graham: Over the short term the market is a voting machine, but over the long term it's a weighing machine. One imperfect but simple way to consider how the market perception of a company has shifted is to compare the change in the earnings per share (EPS) with the share price movement.
 During the unfortunate half decade during which the share price slipped, Global Payments actually saw its earnings per share (EPS) improve by 17% per year. So it doesn't seem like EPS is a great guide to understanding how the market is valuing the stock. Alternatively, growth expectations may have been unreasonable in the past.
Because of the sharp contrast between the EPS growth rate and the share price growth, we're inclined to look to other metrics to understand the changing market sentiment around the stock.
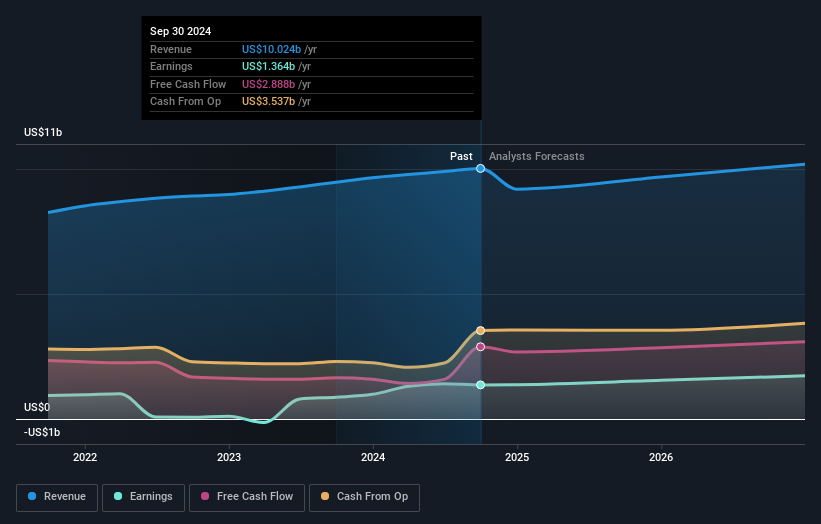
We don't think that the 0.8% is big factor in the share price, since it's quite small, as dividends go. Revenue is actually up 12% over the time period. A more detailed examination of the revenue and earnings may or may not explain why the share price languishes; there could be an opportunity.
You can see below how earnings and revenue have changed over time (discover the exact values by clicking on the image).
We consider it positive that insiders have made significant purchases in the last year. Even so, future earnings will be far more important to whether current shareholders make money. If you are thinking of buying or selling Global Payments stock, you should check out this free report showing analyst profit forecasts.
What About Dividends?
When looking at investment returns, it is important to consider the difference between total shareholder return (TSR) and share price return. The TSR is a return calculation that accounts for the value of cash dividends (assuming that any dividend received was reinvested) and the calculated value of any discounted capital raisings and spin-offs. It's fair to say that the TSR gives a more complete picture for stocks that pay a dividend. We note that for Global Payments the TSR over the last 5 years was -30%, which is better than the share price return mentioned above. The dividends paid by the company have thusly boosted the total shareholder return.
A Different Perspective
Global Payments shareholders gained a total return of 3.5% during the year. Unfortunately this falls short of the market return. But at least that's still a gain! Over five years the TSR has been a reduction of 5% per year, over five years. It could well be that the business is stabilizing. It's always interesting to track share price performance over the longer term. But to understand Global Payments better, we need to consider many other factors. For instance, we've identified 3 warning signs for Global Payments that you should be aware of.
Global Payments is not the only stock that insiders are buying. For those who like to find lesser know companies this free list of growing companies with recent insider purchasing, could be just the ticket.
Please note, the market returns quoted in this article reflect the market weighted average returns of stocks that currently trade on American exchanges.
Have feedback on this article? Concerned about the content? Get in touch with us directly. Alternatively, email editorial-team (at) simplywallst.com.
This article by Simply Wall St is general in nature. We provide commentary based on historical data and analyst forecasts only using an unbiased methodology and our articles are not intended to be financial advice. It does not constitute a recommendation to buy or sell any stock, and does not take account of your objectives, or your financial situation. We aim to bring you long-term focused analysis driven by fundamental data. Note that our analysis may not factor in the latest price-sensitive company announcements or qualitative material. Simply Wall St has no position in any stocks mentioned.
