
 美国历史上看,联邦财政往往逆周期,表现在财政赤字率与失业率的高度相关:经济下行压力大、失业率高企时,做大财政托举经济。但也存在几次财政顺周期时期,多数对应财政有亟需解决的经济之外的如“安全”等问题。2018年以来,新一轮财政顺周期开启,贫富分化、再工业化等结构性问题,呼唤持续做大功能性财政,来应对经济周期之外的挑战。
Source: CICC Commentary
Author: Zhang Jundong, Fan Li, Zhang Wenlang
With the expectation of a basic stable market and interest rate cuts in September [1], trading style has changed. After the June CPI and retail sales data were released, large-cap growth stocks led by AI concepts have clearly pulled back, while gold, small-cap stocks, and real estate, consumer, manufacturing, and bank-related stocks in the Dow have performed relatively well. The trading main line behind seems uncertain, and there has been a large discrepancy in the market's judgment on whether the US economy will have a "soft landing" or a "hard landing" after interest rate cuts. Is the market currently experiencing a short-term cut in style or a long-term change in style?
We believe that with the basic expectation of interest rate cuts being largely fulfilled, the space for interest rate cut trading ("buying on expectations") may be significantly squeezed, while the "cyclical trading" after interest rate cuts is gaining momentum (see "All kinds of interest rate cut trading are the same, but the trading logic after interest rate cuts is different"). Unlike interest rate cut trading, cyclical trading mainly prices the recovery of terminal demand and the restart of the economic cycle after interest rate cutting. Its supporting logic is the resilience of US household demand, large fiscal and re-industrialization, and more deeply, the "realization from empty to real" of the total scale and structural resilience of the US economy. Under the support of total-scale resilience of the economy, the interest rate cut may be relatively limited (that is, a "shallow" interest rate cut), which is more beneficial to the real economy, especially profitable-supporting enterprises, and has a relatively limited boost to valuation.
In terms of pace, Trump Trade 2.0 may accelerate the arrival of cyclical trading, given the increasing probability of Trump's recent election victory, stronger fiscal dominance (monetary coordination), industrial return, and potential weak US dollar in his policy ideology. At the same time, we also remind that due to the uncertainty caused by the election results, US stocks may enter a relatively high volatility period in the July-October of each election year; and after the uncertainty of the election dissipates, US stocks and bond rates often rise, and on average, value stocks perform better than growth stocks after the election (see "Major asset classes in US election years: seeking certainty in uncertainty").
Authors: Zhang Jundong, Fan Li, Zhang Wenlang
Difficult to cut expenditures, pushing for tax cuts, fiscal tightening is difficult
On November 22nd local time, the elected US President nominated hedge fund manager Scott Besent as Treasury Secretary, advocating to reduce the budget deficit rate to 3% by 2028. Prior to this, Trump appointed American entrepreneur Musk to jointly establish and lead the federal government advisory agency 'Department of Government Efficiency (DOGE),' to 'abolish bureaucratic agencies, cut regulations, and restructure the government.' Musk stated that 'at least 2 trillion US dollars in federal spending can be cut,' which is approximately 30% of the total federal spending for the 2024 fiscal year, but did not specify a specific timeline to complete the reduction plan. A series of appointments by the Trump administration indicate that fiscal consolidation seems imminent. However, we expect that the scale of federal fiscal expenditure that can be cut is relatively limited, and given that Trump has also proposed a large-scale tax cut plan to reduce fiscal revenues, and Besent stated on November 24th local time that his top policy priority is to fulfill the tax cut promise, we believe that it may be difficult to effectively reduce the deficit during the Trump 2.0 era.
The necessity and importance of expanding fiscal policy
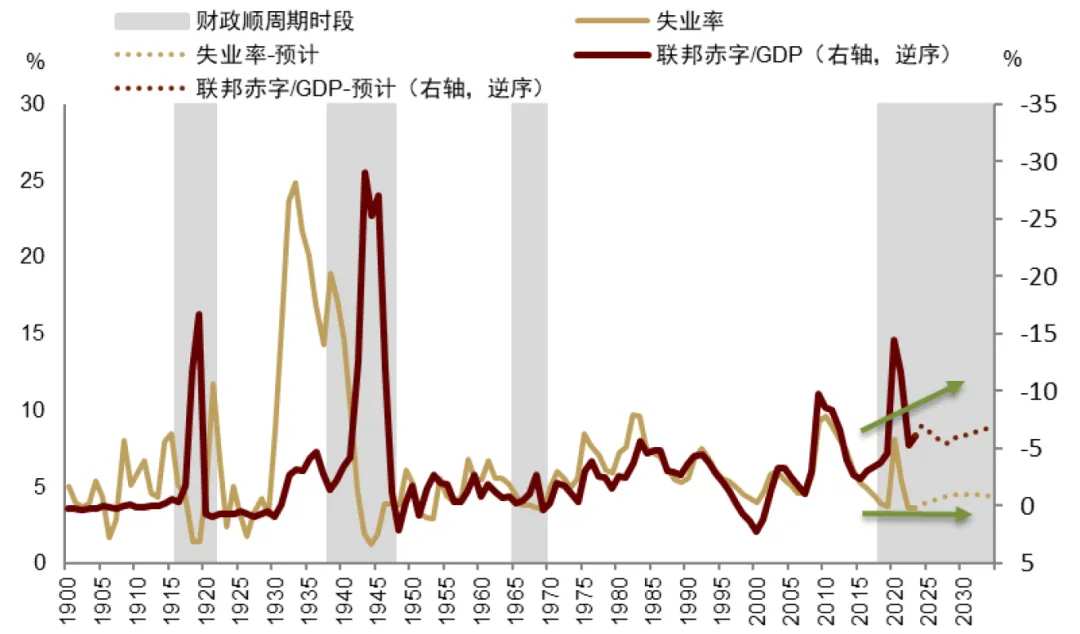
Looking at US history, federal finances tend to be countercyclical, reflected in the high correlation between the fiscal deficit rate and the unemployment rate: when there is great economic pressure and high unemployment, expanding fiscal policy supports the economy. However, there have also been several pro-cyclical periods in fiscal policy, most of which correspond to non-economic issues that urgently need addressing such as 'security.' Since 2018, a new pro-cyclical fiscal period has begun, with structural issues such as income inequality and re-industrialization calling for continued expansion of functional fiscal policy to address challenges beyond the economic cycle.
 Chart: US fiscal policy entering a pro-cyclical phase, often with 'functional' tasks
From the perspective of internal public opinion, addressing wealth inequality urgently requires fiscal efforts to alleviate it. Starting in the 1980s, the Reagan administration in the USA entered a period of 'prioritizing efficiency over distribution' in terms of fiscal policies, where factors such as financial deregulation and weakening of labor unions have exacerbated the wealth gap. Due to the lack of industrial policies to protect domestic industries, non-competitive mid-to-low-end manufacturing industries have relocated overseas, leading to a substantial reduction in manufacturing jobs, a declining trend in labor compensation ratio, and income distribution shifting towards capital or high-income groups.
Chart: Large fiscal policies alleviate, while small fiscal policies intensify wealth inequality.
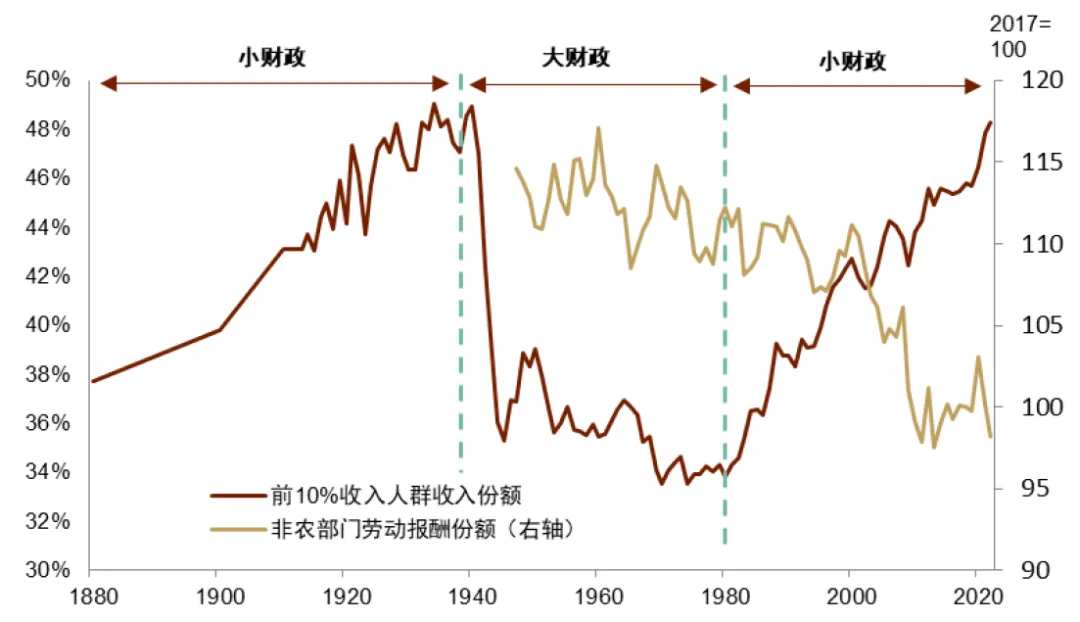
Chart: Following the shift towards small fiscal policies from the Reagan to Clinton era, the Gini coefficient in the USA increased rapidly.

Chart: During the period of small fiscal policies, industrial outsourcing coincided with a decline in the labor compensation ratio.

Chart: During the period of small fiscal policies, industrial outsourcing was accompanied by an increase in income inequality.

After the 2008 financial crisis, public opinion began to lean towards fiscal efforts to promote the reshoring of manufacturing. In response, the Obama administration passed the "American Recovery and Reinvestment Act", to improve infrastructure such as transportation, broadband networks, and required steel to be produced domestically in the USA, pioneering the attraction of reshoring through industrial policy. Subsequently, Trump's MAGA advocacy and the Biden administration's supply-side economics basically continue this approach and form a bipartisan consensus. However, the cost of reshoring is high, and the long-term underinvestment in American industrial and infrastructure sectors has led to aging in manufacturing, energy, and transportation construction since the 1980s. The industrial equipment needed for production (especially power equipment) is relatively obsolete, subsidizing industrial infrastructure investments will bring sustained fiscal pressure.
Chart: Aging of American manufacturing and infrastructure construction.

Chart: Obsolescence of American industrial equipment.

From the perspective of major powers, the global new round of technology competition led by AIGC is in full swing. The Biden administration's "Infrastructure Investment and Jobs Act" and "Chip Act" are projected to increase the deficit by $256.1 billion and $79.3 billion over 10 years, stimulating industrial infrastructure and semiconductor industry development. Since 2021, a wave of factory construction dominated by the computer and electronic industry has been completed. However, there has been no significant increase in industrial production and employment in related industries. In the Trump 2.0 era, there will be a process of the AI revolution transforming investment and vision into production and popularization. Whether through tax cuts or fiscal subsidies in the form of increased spending, the road ahead is challenging.
Chart: Deficit increase due to infrastructure and chip acts.

Chart: A round of investment boom in the computer and electronic industry has basically been completed.

Chart: The investment in the computer and electronic industry has increased, but industrial production has not significantly improved.

Chart: There is not much increase in employment in the computer and electronic industry.

Upon closer examination of the fiscal accounts, the difficulty of reducing the deficit is relatively high.
So, if we must cut expenses, how much can we cut in the end? Can it cover the impact of Trump's extension of the TCJA law? Will the deficit shrink?
Looking at the breakdown of fiscal expenditures, mandatory expenses such as social welfare are the largest category, including social security, Medicare, Medicaid, education, income security, veterans' benefits, totaling about $4.5 trillion in the 2024 fiscal year, accounting for 67% of total expenditures. In addition, there are essential fixed expenses such as interest and defense. These items account for around 90% of total expenditures. Welfare spending has seen a significant increase post-pandemic, with Trump stating that he will not cut and will continue to protect social security and Medicare spending. We focus on the projects that may see significant cuts: Medicaid and income security (especially food stamp expenditures) are the targets of the Republicans' attacks, while student loan spending is an important achievement of the Biden administration and may face reversal by the new Trump administration. If the spending levels of Medicaid, income security, and student loans are restored to the levels of the 2019 fiscal year (Trump 1.0 period), considering the impact of inflation, they could be reduced by $132.2 billion, $59.2 billion, and $144.8 billion in the 2024 fiscal year, respectively. Additionally, Musk has expressed intentions to streamline the federal government. However, the share of federal employees in the total population is already at its lowest level since World War II, and public sector wage growth has lagged behind the private sector since 2019. Even if the approximately 0.16 million new positions added since 2019 are eliminated, and actual income levels are restored to the 2019 status (considering inflation), we estimate that the expenditure reduction would only amount to $25.6 billion. Adding up these cost reduction items, we expect the maximum limit for expenditure cuts to not exceed $400 billion, and this cut is unlikely to be completed within a single fiscal year.
Chart: Major fiscal expenditures in the USA come from social welfare, military expenses, and interest.

Chart: Welfare spending has risen significantly after 2020.

Chart: Federal employees have a low proportion in the population.

Chart: Since 2019, the salary growth of federal civil servants has been lower than that of the private sector.

As a reference, the Committee for a Responsible Federal Budget estimated that considering the current bipartisan consensus and relatively easy-to-implement policies for revenue increase and spending cuts, the deficit that can be reduced in the next ten years is about $700 billion, which means only about $70 billion per year, accounting for 3% of the fiscal year 24 deficit and 1% of spending.
On the revenue side, Trump's tax cut plan may lead to a large additional deficit. According to the Wharton Budget Model, extending TCJA and further reducing corporate and individual tax rates over the next decade will increase the deficit by an additional $5.8 trillion; considering the expansion of the tax base due to economic growth, an additional $4.1 trillion deficit will be added, averaging over $400 billion per year. Based on the Tax Foundation's estimate, including various other proposed tax cuts by Trump, an additional $7.8 trillion deficit will be added in the next ten years, averaging $770 billion per year.
Chart: Extending TCJA and tax cuts are estimated to bring about $410 billion in annual fiscal deficits over the next 10 years.

Comprehensive spending cuts and tax reduction plans might lead to an expanding and challenging fiscal deficit.
In fact, the plan to reduce the deficit is not proposed for the first time. Republican Senator Rand Paul of Kentucky has long been committed to promoting fiscal deficit reduction. In September of this year, his bill to reduce the deficit by 6% annually for the next 5 years (approximately $110 billion per year) was overwhelmingly rejected in the Senate vote (39 in favor - 58 against). Even though the Republican seats in the new Senate increased from 49 to 53 in the recent election, the likelihood of a significant deficit reduction bill passing remains relatively low, given the consensus between the two parties on major fiscal and industrial policy issues.
[1]https://www.wsj.com/politics/trump-treasury-secretary-scott-bessent-cabinet-2470c09a
[2]https://www.reuters.com/world/us/trump-says-elon-musk-vivek-ramaswamy-will-lead-department-government-efficiency-2024-11-13/
[3]https://truthsocial.com/@realDonaldTrump/posts/113472884874740859
[4]https://www.nytimes.com/2024/11/16/us/politics/dept-government-efficiency-explainer.html
[5]Our annual upper limit estimate is about $400 billion. The $2 trillion reduction plan mentioned by Musk, if aiming to be achieved within one year, has a relatively low likelihood.
[6]https://www.reuters.com/world/us/trump-treasury-pick-scott-bessent-prioritize-tax-cuts-wsj-reports-2024-11-25/
[7]https://eprints.lse.ac.uk/59386/1/blogs.lse.ac.uk-Rising_income_inequality_in_the_US_was_fuelled_by_Ronald_Reagans_attacks_on_union_strength_and_contin.pdf
https://2009-2017.state.gov/recovery/index.htm
https://www.forbes.com/sites/alisondurkee/2024/11/06/how-trump-could-affect-social-security-and-medicare-group-warns-funds-could-run-out-in-6-years-under-his-plans/
https://www.washingtonpost.com/business/2024/11/18/gop-targets-medicaid-food-stamps/
https://www.cnbc.com/2024/11/20/could-trump-reinstate-forgiven-student-debt-heres-what-experts-say.html
https://www.washingtonpost.com/business/2024/11/20/musk-ramaswamy-government-cuts/
https://www.crfb.org/blogs/700-billion-easy-deficit-reduction
Other tax relief programs include local taxation (SALT), tips, overtime pay, and other tax deductions, see details at https://taxfoundation.org/research/all/federal/donald-trump-tax-plan-2024/
https://www.paul.senate.gov/dr-rand-paul-forces-vote-on-six-penny-plan-to-balance-the-federal-budget-in-five-years/
Editor / jayden

