
 周三,现货黄金价格在创下历史新高后转跌。分析师指出,美元和美债收益率走强,加之中东紧张局势有所缓解,这成为金价周三大跌的主要原因。
#GoldTechnical Analysis#24K99 News On Thursday, October 24th, during the Asian session, spot gold moderately rebounded after yesterday's sharp drop, and currently the gold price is around $2722 per ounce. FXStreet's Chief Analyst Valeria Bednarik wrote an article analyzing the technical outlook for gold.
Bednarik wrote that spot gold reached a new all-time high on Wednesday, hitting $2758.36 per ounce at one point, and then turned downward. Due to the positive momentum of the US dollar in the forex market, gold fell from such high levels to around $2720 per ounce.
Bednarik pointed out that the target for gold is to extend its corrective decline, potentially breaking below the $2700 per ounce level.
 On Wednesday, the price of spot gold turned lower after hitting a new all-time high. Analysts pointed out that the strength of the US dollar and US bond yields, combined with a slight easing of tensions in the Middle East, were the main reasons for the sharp drop in gold prices on Wednesday.
In addition, Bloomberg reported thattechnical indicatorsIndicating that the recent upward trend may be too strong, 14 daysRelative Strength IndexShowing that gold is overbought, therefore there is a pullback in gold prices.
Spot gold plummeted 33.44 USD at the closing on Wednesday, with an intraday decline of 1.22%, at 2715.24 USD per ounce. The gold price reached a peak of 2758.45 USD per ounce during the session, setting a new historical high.
Senior Market Strategist at RJO Futures, Bob Haberkorn, stated that there were some profit-taking trades in the market, and with rising Treasury yields, considering the yield trend, it will be difficult for gold to rise.
Short-term technical outlook for gold
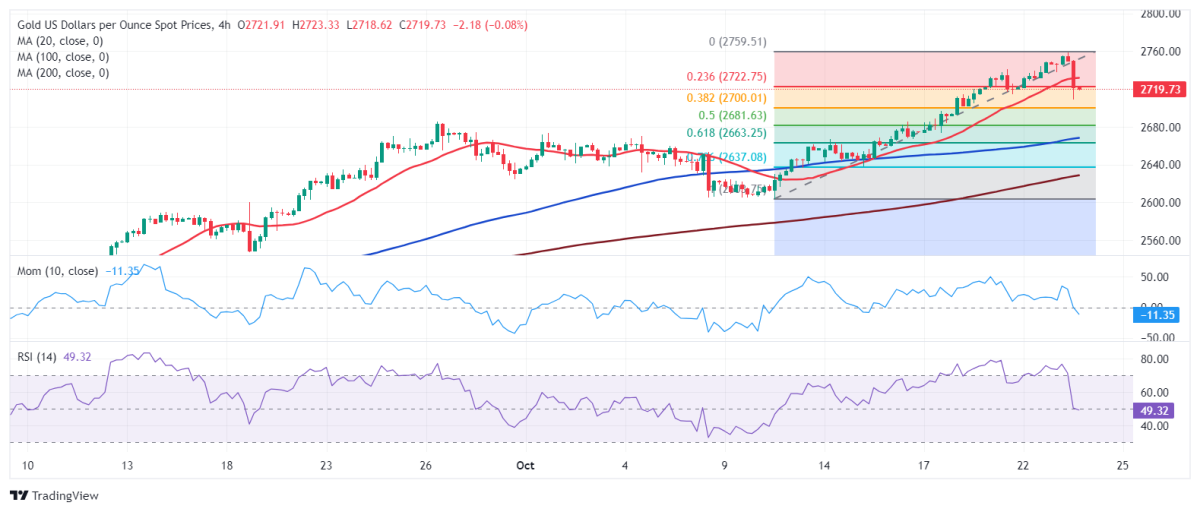
Bednarik stated that the current gold price rebound trend at 23.6% Fibonacci retracement level of 2601.87/2756.36 USD per ounce is near 2721.20 USD per ounce. The gold price decline seems corrective, possibly continuing down to the 38.2% retracement level of 2698.66 USD per ounce.
Bednarik pointed out that on the daily chart, the technical indicators are turning downwards, with the relative strength index (RSI)RSICorrected overbought conditions, with the momentum indicator falling from the October high. Both of these indicators are supporting another round of gold price declines, but breaking below Wednesday's low of $2708.57 per ounce will help confirm the downtrend. Additionally, it is worth mentioning that the moving average lines maintain a strong upward slope well below the current levels, keeping the long-term bullish trend still valid.
Bednarik added that the 4-hour chart shows that gold prices may continue to decline in the short term. Technical indicators are almost vertically downward, crossing the midline into negative territory. At the same time, gold prices are losing bullish momentum and leveling off, with the current level near $2732.70 per ounce forming dynamic resistance. Nevertheless, the 100-period SMA and 200-period SMA are still moving higher well below the current gold price levels, limiting the downside potential of gold prices.
(Source: FXStreet)
Valeria Bednarik provides the latest important gold price.Resistanceand resistance levels:
Resistance: $2708.50 per ounce; $2698.60 per ounce; $2680.10 per ounce.
Support: $2732.70 per ounce; $2744.10 per ounce; $2758.40 per ounce.
At 11:11 Beijing time, spot gold is trading at $2722.24 per ounce.
