
 分析人士指出,中东局势紧张和美国总统选举结果难料促使投资者买入黄金,推动价格创下历史新高。
#Gold Technical Analysis# 24K99 News On Wednesday, October 23rd, during the early European session, spot gold saw a short-term rally, with the price just breaking through $2755 per ounce, reaching a high of $2755.41 per ounce, setting a new record high. FXStreet senior analyst Dhwani Mehta authored an article analyzing the technical trends of gold.
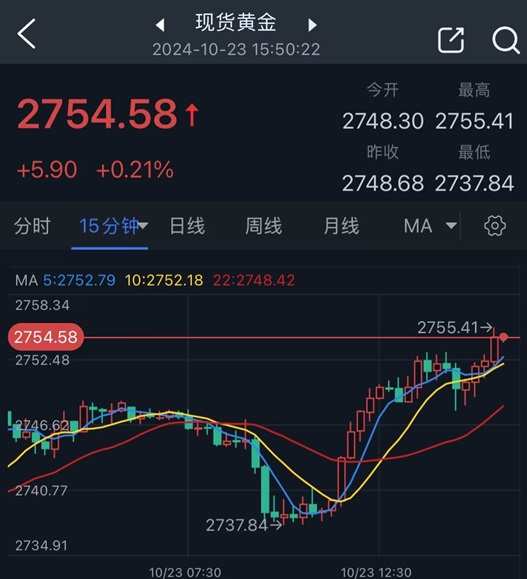
(Source: 24K99) 15-minute chart for spot gold.
Gold continued its upward trend from the previous trading day. The price of spot gold surged $29.19 and closed on Tuesday with a 1.07% increase.
 Analysts pointed out that tensions in the Middle East and uncertainties surrounding the outcome of the US presidential election prompted investors to buy gold, driving prices to historic highs.
The ongoing military conflict in the Middle East was confirmed on Tuesday when Israel acknowledged the killing of Hashem Safieddine, a possible successor to the deceased leader of Hezbollah, Nasrallah. This may provoke a strong retaliation from Hezbollah.
The uncertainties brought by these international events, along with a loose monetary policy environment, have led investors to turn to lower-risk investment tools such as gold.
Mehta wrote that the escalating geopolitical tensions between Iran and Israel, as well as the resurgence of de-dollarization discourse, have supported the popularity of gold.
The three-day BRICS summit is in progress. Speculation about gold-backed currencies and competition with the US dollar resurfaces as BRICS central banks strive to move towards de-dollarization. BRICS countries' gold reserves account for about 20% of the global total.
Mehta pointed out that gold traders will also focus on US existing home sales data and speeches by Federal Reserve officials to seek new trading incentives. Meanwhile, the dynamics of risk trends and US Treasury yields will continue to drive the trend of gold prices.
How will gold perform?
Mehta stated that looking at the daily gold chart, the 14-day Relative Strength Index (RSI) has fallen from an extremely overbought condition and is currently trading near 72.00. This indicator gives hope to gold buyers.
On the upside, Mehta pointed out that the resistance at the uptrend line of $2756 per ounce could become a strong barrier. Once this resistance is effectively broken, it could drive gold to a new round of gains and rise towards the psychological level of $2800 per ounce.
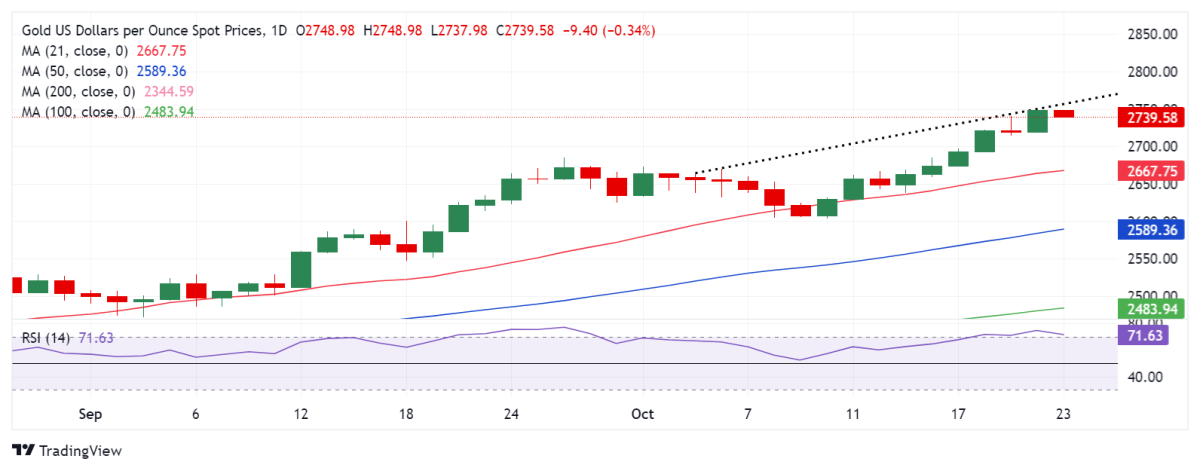
(Spot gold daily chart source: FXStreet)
On the other hand, if gold experiences a decline, the price may test $2730 per ounce; Mehta stated that if it continues to fall below this level, the price may test yesterday's low of $2719 per ounce. The last line of defense for gold buyers is expected at the $2700 per ounce level.
At 15:50 Peking time, spot gold is reported at $2,754.58 per ounce.
