
 丽盈先从价格趋势分析给大家参考,首先是盘口的K线形态在2600至2650区间内波动,形成窄幅震荡整理形态,前期高点2663和低点2630构成短期压力与支撑,
Coin Circle Lying: Ethereum sideways over the weekend at 10.20, but hiding the upcoming opportunity! Latest market analysis.
Article published on 2024.10.20 at 02:30.
The sideways trend over the weekend has been basically determined. The remaining task is to wait it out. I don't want the market to trend one-sided like last weekend, which rarely happens. Most of the time, it's like this week, moving sideways. The reason is very simple, the block orders have finished harvesting over the weekend, popping the Champagne, resting, living in a dream. At this time, everyone assumes the market trend, and no one stirs up trouble because those who stick out at this time will most likely be cleared by the block orders. So let the market move sideways, let others be others, let yourself be yourself.
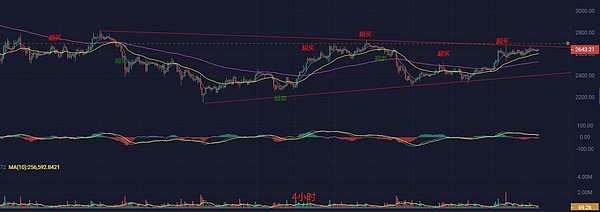
 Starting from the price trend analysis, Lying refers to the K-line pattern in the range of 2600 to 2650 oscillating, forming a narrow range shock consolidation pattern. The previous high point, 2663, and low point, 2630, form short-term resistance and support.technical indicatorsMACD shows both DIF and DEA are negative values and gradually converging, indicating a weakening bearish force, with the possibility of appearing.Golden crossSignal, under the condition that the bullish trend remains unchanged, there may be a new one-way trend.
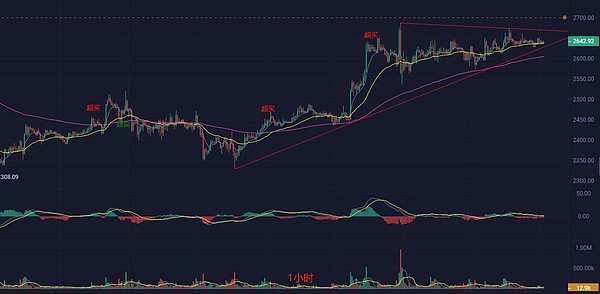
The relative strength index is currently at 56.70, in the neutral zone, not in overbought or oversold territory, indicating that the market temporarily lacks a clear trend direction. The trend indicator EMA7 is close to the current price, with the 30 and 120 EMA in a bullish alignment. The long-term trend still tends to be upward. Additionally, with the current significant decrease in trading volume, it indicates a cautious market sentiment. Several previous candlesticks accompanied by increased volume indicate some bid support, therefore the overall trend is biased towards a bullish position, with a main idea of favoring long positions over short positions.RSIShort-term strategy reference: The bullish trend remains unchanged, but there is consolidation within the day.
The relative strength index is currently at 56.70, in the neutral zone, not in overbought or oversold territory, indicating that the market temporarily lacks a clear trend direction. The trend indicator EMA7 is close to the current price, with the 30 and 120 EMA in a bullish alignment. The long-term trend still tends to be upward. Additionally, with the current significant decrease in trading volume, it indicates a cautious market sentiment. Several previous candlesticks accompanied by increased volume indicate some bid support, therefore the overall trend is biased towards a bullish position, with a main idea of favoring long positions over short positions.
Long position entry point at 2600, average down point at 2570, stop-loss point at 2540, target at 2700.
Short position entry point at 2700, average up point at 2730, stop-loss point at 2760, target at 2600.
Reason: The higher time frame is still bullish, rational thinking for a reasonable layout, the content of the article is timely, for reference only, trade at your own risk.
The above is a brief analysis of the current market situation by Liying, provided for reference to investors. Over the past ten years, Liying has continuously explored and experienced hundreds of digital assets of various kinds. In this process, Liying has gone through the market's bull market glory and bear market gloom, stumbling along the way, accumulating countless valuable experiences and profound lessons. As a female trader who strives in this challenging field, Liying feels a responsibility to share her insights and experiences, hoping to help others with dreams find their own position in this unpredictable market and embark on their own journey to success.
