
 现货 ETF 已成为比特币生态系统的主要工具,为机构投资者提供了受监管的切入点。根据 Kesmeci 的说法,比特币现货 ETF 的平均成本在整个 2024 年都是一个关键
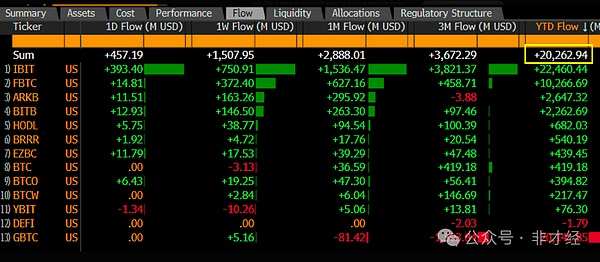
According to data shared by Bloomberg, these funds have seen inflows of over $1.5 billion in the past week, reaching the $20 billion mark, while during this week, the price of bitcoin has risen by over 10%, approaching $67,000. Following IBIT, Fidelity's FBTC saw inflows of $10.2 billion, followed by ARK 21Shares Bitcoin ETF. So far this year, the only bitcoin ETF with outflows is the Hashdex Bitcoin ETF (DEFI), with outflows of $1.79 million, along with Grayscale's GBTC, with outflows of $20.1 billion.
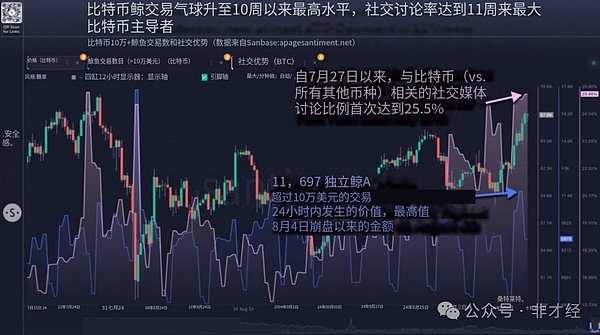
Recently, there has been a significant surge in the number of whale trades in Bitcoin, indicating a large amount of transfers by whales. Specifically, in a peak 24-hour period, these massive entities made a total of 11,697 transfers.
Generally, it is difficult to determine which transfer activities whales are involved in based solely on the number of whale trades, as sell and buy trades may look the same from an indicator standpoint. However, accompanying price action can provide some clues.
 Spot ETFs have become a key tool in the Bitcoin ecosystem, providing regulated entry points for institutional investors. According to Kesmeci, the average cost of Bitcoin spot ETFs has been a key factor throughout the entirety of 2024, laying the foundation for price stability of this asset.Resistance for institutions.
This level is set at 57,000 and has remained strong throughout the year, with only two major exceptions. The $57,000 price level is important because of its technical support and psychological impact on spot ETF investors. Slight outflows during turbulent periods are not enough to disrupt the overall market. Even during the 'arbitrage trade' crisis in Japan, where many expected a stronger correction in the market, the overall sentiment of spot ETF investors remained calm.
Market trend on October 18:

Daily chart shows 3 consecutive bullish days, accompanied by a correction of the strong uptrend with a doji candlestick pattern. The price was in a wide range oscillation yesterday, testing the strong support level at 66,600 to find the bottom, further moving this strong support level upwards. In terms of trend indicators, the MA5 and MA10 are both rising along with the price, without deviating too far, indicating further room for exploration on the upside, showing continued strength.
Currently maintaining a bullish trend on the four-hour chart, observing the trend still stabilizing above 67,000 without retracting. The support below is at the 66,000 level, showing strong support. As long as there is no effective breakthrough, it remains within our control! Friday will be a critical moment for the weekly closing, which will be more aggressive than yesterday in all aspects. From various perspectives and analyses, we still remain bullish on a slight retracement followed by further upward breakthroughs! Therefore, operationally, it is advisable to go long on pullbacks.technical aspectsTherefore, we are still bullish on continuing the upward trend after a minor retracement! Hence, operationally, buying on dips is recommended.
The market changes rapidly, and specific entry and exit points should be determined based on real-time market conditions. Follow the trend when breaking through key levels! Enter the market with a small position, avoid greed, and take profits. Pay attention to risk management! If you want to follow the trades, feel free to discuss and exchange ideas with me.
