
 Mehta写道,金价的日线图
#GoldTechnical Analysis#24K99 News At the European morning session on Thursday (October 17), spot gold maintained its intraday rebound trend, with the current price near $2683 per ounce. FXStreet Senior Analyst Dhwani Mehta wrote on Thursday, analyzing the technical trend of gold price.
Mehta pointed out that the gold price is near historical highs, and gold buyers are waiting for US retail sales data to further boost the gold price.
Spot gold closed up $10.99 on Wednesday, up 0.41%, at $2673.59 per ounce. The gold price rose to $2685.75 per ounce during the Asian market session on Thursday, setting a new record high.
 Mehta wrote that the daily chart of the gold pricetechnical aspectsindicates more upside potential, with a target of reaching $2700 per ounce.
At 20:30 on Thursday Beijing time, the U.S. Census Bureau will release the retail sales data for September.
According to a reputable media survey, the retail sales index in the USA is expected to increase by 0.3% in September, compared to a 0.1% increase in August.
US retail sales data are commonly known as "Terrible Data" because they usually have a significant impact on financial markets, which may affect the trends of assets such as the US dollar and gold.
Analysts point out that if the retail sales data in the USA falls short of expectations, the US dollar may suffer a blow, thus pushing the gold price to continue its strength.
Mehta pointed out that the 25 basis point rate cut by the Federal Reserve in November is already a certainty. Therefore, it is unlikely that the retail sales data in the USA will change these expectations. However, this may affect the market's expectations for another rate cut in December.
How to trade gold?
Mehta stated that the gold price closed above the key resistance level of $2670 per ounce on Wednesday the 14th.Relative Strength Index(RSITrading above the mid-term resistance indicates that gold prices still have more upside potential.
Mehta pointed out that if the gold price continues to break through the historical high of $2686 per ounce, it will trigger a new round of uptrend to the psychological level of $2700 per ounce.
If gold continues to rise, buyers may challenge the psychological barrier of $2750 per ounce.
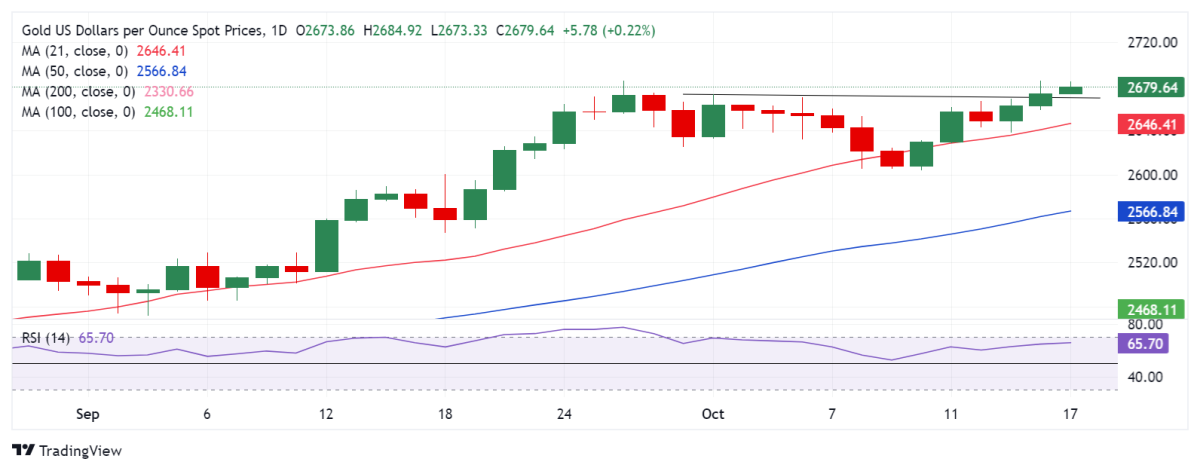
(Spot gold daily chart source: FXStreet)
On the downside, Mehta added that the gold price in the short termResistanceAt $2670 per ounce, the previous resistance level has now become a support level.
If the gold price falls below the above level, sellers will target the key 21-day Simple Moving Average (SMA) support level of $2646 per ounce. Before that, the Wednesday low of $2659 per ounce may test the call commitment.
At 16:15 Beijing time, spot gold was trading at $2682.83 per ounce.
