
 随着交易员套现,SUI 将进行 55% 的修正
SUI has recently attracted widespread attention, reaching its peak in development. By the end of this week, its price reached a historic high of $2.30, ranking higher than top altcoins like Polkadot (DOT), thus entering the top 15 cryptocurrencies. For those who support SUI, this achievement has ignited hope as they believe it will become a major competitor in the market.
DeFi has noticed the price surge of SUI, with a Total Value Locked (TVL) of $1 billion. The token's ranking is higher than Avalanche (AVAX) and Polygon (MATIC). Investors have observed SUI's increasing position in the DeFi market, with SUI forecasts showing a continued positive trend in the next three months, with a potential increase of up to 240%.
Coingecko's data shows that at the time of writing this article, SUI's trading price is $2.12, with a rebound of 4.86% in the past 24 hours, but a continuous increase of 12.92% over the past 7 days.
 With traders taking profits, SUI is expected to undergo a 55% correction.
SUI is the native token of the Layer 1 (L1) blockchain Sui Network, which rose to a historic high of $2.36 on October 14th. However, with the momentum of profit-taking activities increasing, SUI has started to show a downward trend.
As of the time of writing this article, the altcoin's trading price is $2.12, despite a significant pullback over the past two days. But its technical setup indicates that SUI may break this downtrend. However, the question remains: How low will SUI fall?
During the Sui Dynasty, merchants traded goods for profit.
At the current price, the trading price of SUI is slightly higher than the resistance level of $1.97. If the continuously rising selling pressure causes this level to not hold, the price of SUI will seek support at its Ichimoku Cloud, which tracks its market trend and momentum and acts as support/resistance levels.
Just like in the case of SUI, if the price approaches from above, the Ichimoku Cloud can act as a support/resistance indicator.ResistanceIf the price enters or falls below the cloud, it indicates a shift in trend from bullish to bearish. The cloud typically acts as a transition zone; falling into or below the cloud indicates weakening momentum, possibly signaling a potential bearish phase.
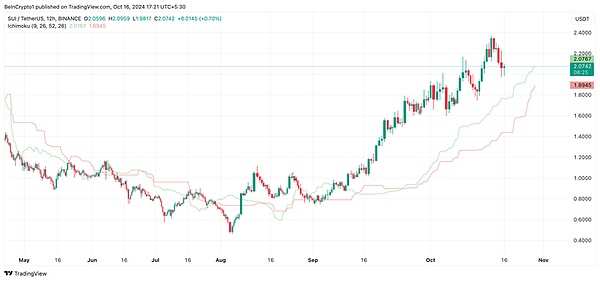
The Moving Average Convergence Divergence (MACD) reading for SUI confirms this bearish outlook.MACDIts MACD line (blue) recently crossed below its signal line (orange), indicating a shift in market sentiment from bullish to bearish.
The cross below the signal line indicates that the short-term moving average of the asset (represented by the MACD line) is falling faster than the long-term average (signal line). This usually reflects an increase in selling pressure in the market, with many traders considering it a signal to sell or exit long positions.

What is the next step for SUI?
The decline in open contracts of SUI is another strong indicator of the decreasing interest in this altcoin. After reaching a historical high of 0.709 billion USD on October 14th, the open contracts have been steadily declining, indicating that the number of traders holding active positions in SUI is decreasing. In just two days, the coin has dropped by 24% to the current value of 0.538 billion USD.

This decline indicates a decrease in market participation, which may suggest that investors are liquidating their positions, anticipating further price declines. Despite these concerns, the recent development prospects for SUI remain optimistic, and if new demand enters the market, this bearish outlook may be invalidated.

SUI may retest its historical high of 2.36 USD and possibly surpass this level.
Moreover, based on the current price trend, the stock is expected to show an upward trend, as subsequent bullish events such as interest rate cuts will increase market liquidity and significantly expand the scale. In the next three months, the price of SUI is expected to rise by 244%, attracting many hopeful investors.
However, investors are still advised to proceed with caution. Considering the large volume of insider trading and concerns about valuation, the future may not be as optimistic as expected. It is crucial to monitor market dynamics and be prepared for the risks associated with the rapid rise of SUI.Technical AnalysisIt is crucial to address the risks posed by the rapid rise of SUI.
In short.
SUI's stock price reached a high of $2.36 on October 14, but fell by 14% due to profit-taking, currently trading at $2.12. Some indicators suggest that the bearish momentum on SUI may continue in the short term, experiencing consolidation for a period. However, with increasing demand, these bearish prospects may be invalidated and potentially soar further.technical indicatorsIndications show that the bearish trend on SUI may persist, potentially undergoing a period of consolidation in the short term. However, with increased demand, these bearish prospects will be invalidated and may further soar.
