
 Rubner援引90余年来的数据证明,每年10月中到年末,美股往往表现较好。1928年以来,标普500每年10月15日到12月31日的平均回报率为5.17%,这意味着,到今年年末,标普将在本周一收盘将近5860点的基础上涨至6160点。
Since 1928, the average return of the S&P 500 from October 15 to December 31 was 5.17%. If it was an election year, S&P's average return for the past two and a half months reached 7.04%. Calculating the closing of the day this Monday, S&P will rise to 6270 points by the end of the year. US stocks are entering a positive trading environment: after October 25, the biggest buyers of US stocks this year “lifted the ban” on repurchases of listed companies; before Halloween, the biggest sellers of US stocksMutual fundsThere was a gradual withdrawal, and mutual funds over $1.8 trillion-dollar all ended the current fiscal year at the end of October.
Last month, Goldman Sachs research capital flow expert Scott Rubner, who accurately predicted a pullback in US stocks at the end of this summer, predicted that US stocks would melt up (melt up) by the end of this year. According to recent reports, Rubner is even more bullish. It is expected that before Halloween on November 1, the S&P 500 index will not rise to 6,000 points, but by the end of the year, it will far exceed 6,000 points.
In the report, Rubner, managing director of Goldman Sachs's Global Marketing Division, wrote, “The stock market sell-off was cancelled, and the rebound at the end of the year began to resonate, and customers switched from hedging from left tail to right tail hedging.” “Institutional investors are now being forced to enter the market given the so-called 'FOMU', that is, many concerns about the poor performance of the benchmark stock index.”
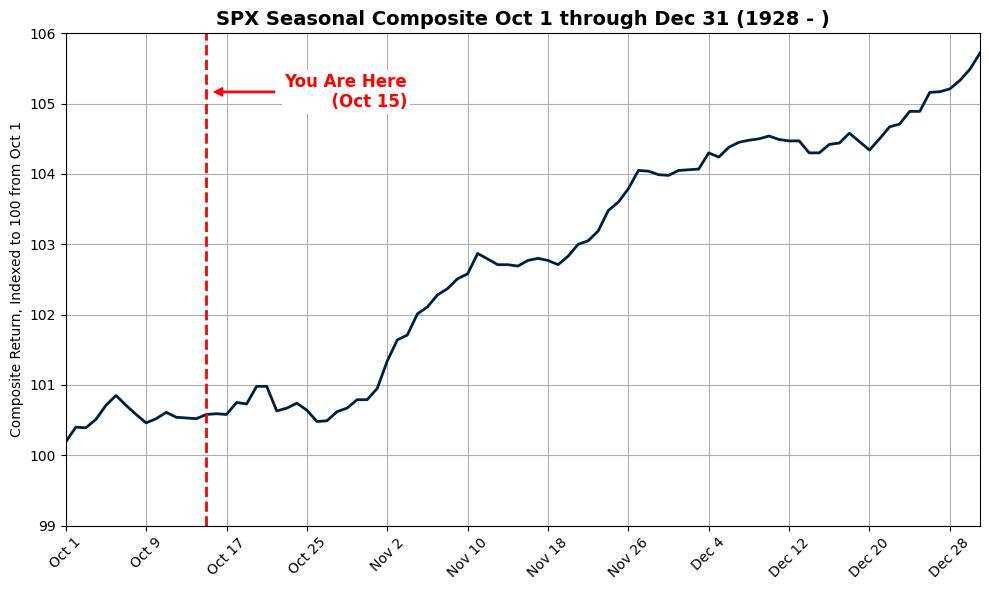
 Rubner cites data from more than 90 years to prove that every year from mid-October to the end of the year, US stocks tend to perform better. Since 1928, the average return of the S&P 500 has been 5.17% every year from October 15 to December 31, which means that by the end of this year, S&P will rise to 6,160 points from a close of 5,860 points this Monday.
And in every election year since 1928, the average return of the S&P 500 from October 15 to December 31 reached 7.04%. Based on this calculation, on the basis of Monday's close, S&P will rise to 6270 points by the end of this year.
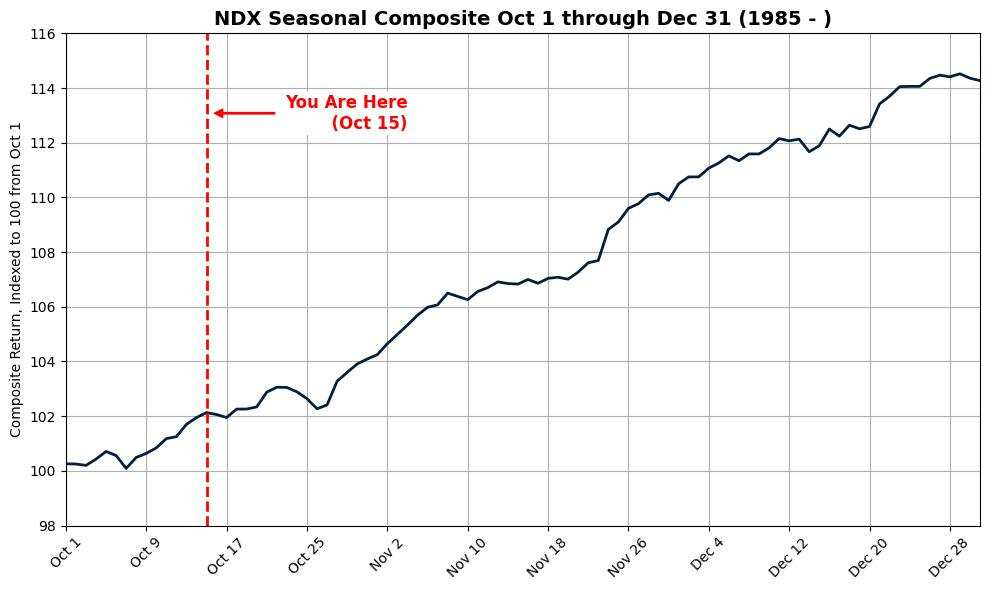
Instead of the Nasdaq 100 index, since 1985, from October 15 to December 31, the index has had an average return of 12.08%. Based on this calculation, the NASDAQ 100 will rise to 22,900 points by the end of this year on the basis of closing this Monday. However, in election years since 1985, the index did not perform as well as in non-election years from October 15 to December 31, with an average return of 7.29%.
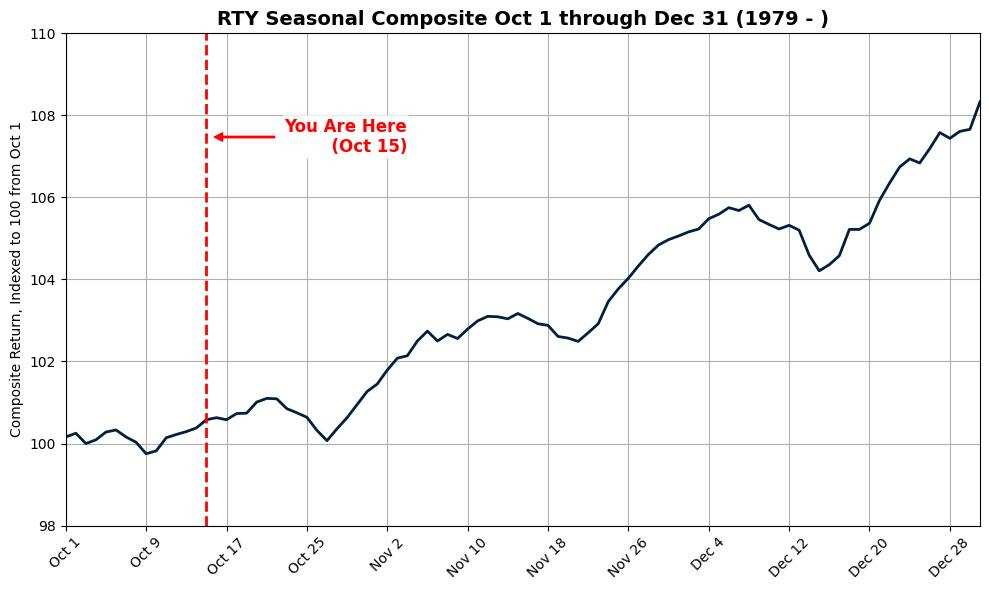
Since 1979,Russell 2000 IndexThe average return from October 15 to December 31 was 7.92%. Based on this calculation, based on Monday's close, the index will rise to 2,425 points by the end of this year. In election years since 1979, the index had a higher average return of 10.08% from October 15 to December 31.
Rubner mentioned the winners of the seasonal year-end rally, pointing out that in the fourth quarter of every year, cyclical stocks tend to outperform defensive stocks. He also mentioned some factors affecting the market. Among them, next week will be the “Super Bowl” of this earnings season, because the constituent companies that account for about 37% of the S&P 500 market value will have to release financial reports.
According to Rubner's report, from the perspective of capital flow, US stocks are entering a positive trading environment. One of the signs is that Goldman Sachs estimates that the quiet period for stock repurchases of listed companies will end on October 25. Listed companies that have become the biggest buyers of US stocks this year will welcome the two months with the highest share of repurchases in the year — November and December. The repurchase scale is expected to reach 6 billion US dollars/day. Goldman Sachs estimates that the volume of buyback execution in November and December accounts for 21.1% of the year.
Another sign is that before Halloween, the biggest seller of US stocks, mutual funds, gradually withdrew. Rubner's previous report mentioned that October of this year is the last month of the current fiscal year for most mutual funds. October being the end of the fiscal year may adversely affect price trends, or have had an adverse effect, because funds that have underperformed year to date may be sold off due to tax reporting losses, and funds that have performed well since the beginning of the year may reduce their holdings or return profits.
In this report, Rubner said that all 756 mutual funds with a total asset value of 1.853 trillion US dollars ended the current fiscal year on October 31, 2024.
Furthermore, data since 1996 shows that American households tend to buy stocks in November every year, and the share of capital flowing into mutual funds and ETFs increased dramatically in November, ranking second only to January and April of every year in total asset management, while October was the outflow of capital.
Regarding the upcoming US election in November, Rubner reports that after the election is over, the November volatility will be reset, which may cause systemic strategies (volatility control) and multi-manager funds to be re-leveraged, and even some ultra-short-term opportunistic YOLO mentality will have positive trading performance.
Wall Street News recently mentioned that US non-farm payrolls are growing strongly, which was announced at the beginning of this month. According to the Citigroup Report, the market is refocusing on inflation expectations. As the US election approaches, political factors are gradually becoming important variables affecting the market, so be wary of the impact of Trump's election victory. In this report, Rubner also mentioned that the Trump deal may make a comeback, saying that Goldman Sachs's trading desk is answering questions about the best implementation plan. This is a new trend that has extended the stock market's rebound.
