
 Mehta称,美国国债收益率的回落给美元带来下行压力,让金价买家暂时喘口气。不过,黄金价格可能面临以色列和伊朗之间地缘政治紧张局势缓解的阻力。
#GoldTechnical Analysis#24K99 News On Tuesday (October 15), during the early European session, spot gold rebounded significantly in the short term, with the gold price just breaking through $2653 per ounce. During the late Asian session, the gold price once fell to $2638.06 per ounce, hitting an intraday low. FXStreet senior analyst Dhwani Mehta wrote an article analyzing the technical trends of the gold price.
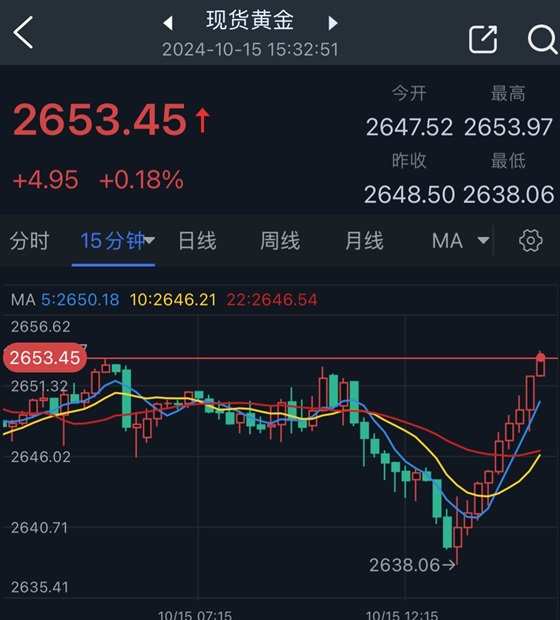
(Source: 24K99) 15-minute chart for spot gold.
Mehta pointed out that as long as the gold price holds above the 21-day moving average of $2635 per ounce, gold may find new demand. Looking at the gold daily chart,Relative Strength Index(RSIMaintain a call.
 Mehta stated that the decline in US Treasury yields has brought downward pressure on the US dollar, giving gold buyers a temporary breather. However, the price of gold may face resistance from the easing geopolitical tensions between Israel and Iran.
Previously, The Washington Post quoted two informed officials as saying that Israeli Prime Minister Netanyahu told the United States that Israel would strike military targets in Iran rather than nuclear or oil targets. The report mentioned that to prevent a full-scale war, there would be a more limited retaliation.
Mehta stated that the focus is now shifting to more speeches from Federal Reserve policymakers to seek new trading catalysts for the US dollar and gold prices. Gold traders may also adjust their positions before the release of US retail sales data on Thursday.
The market continues to bet that the Federal Reserve will cut interest rates by 25 basis points in November. According to CME Group's 'FedWatch Tool', the probability of a 25 basis point rate cut is around 86%.
How to trade gold?
Mehta pointed out that so far this week, the price of gold is still at a critical resistance level.Simple Moving Average(SMA)ResistanceSupported from above, the current moving average support is at $2635 per ounce.
The 14-day Relative Strength Index (RSI) is holding steady above the midline, suggesting that any decline in the gold price could be a good buying opportunity in the near term.
Mehta stated that if the gold price rebounds, the next call target could be the previous high of $2667 per ounce, followed by the recent high of $2670 per ounce. If gold continues to rise, the record high of $2686 per ounce will become the target.
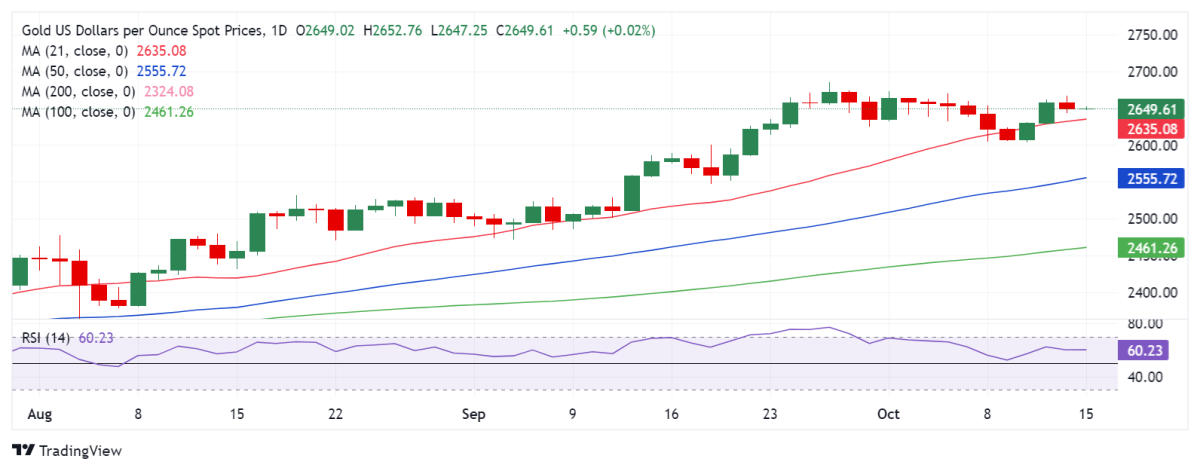
(Spot gold daily chart source: FXStreet)
On the downside, Mehta added that the short-term support for gold is seen at the 21-day moving average. If it falls below this level, then the price of gold will test the three-week low near $2600 per ounce. If gold continues to break below the latter, the downward trend may extend to the September 20th low of $2585 per ounce.
At 15:32 Beijing time, spot gold was trading at $2653.45 per ounce.
