

#GoldTechnical Analysis#24K99 News: During the Asian session on Tuesday (October 15), spot gold suddenly plummeted in the short term, with the price just dropping to around $2643 per ounce, slightly earlier the price was close to $2653 per ounce. FXStreet's Chief Analyst Valeria Bednarik wrote an article analyzing the technical outlook for gold.
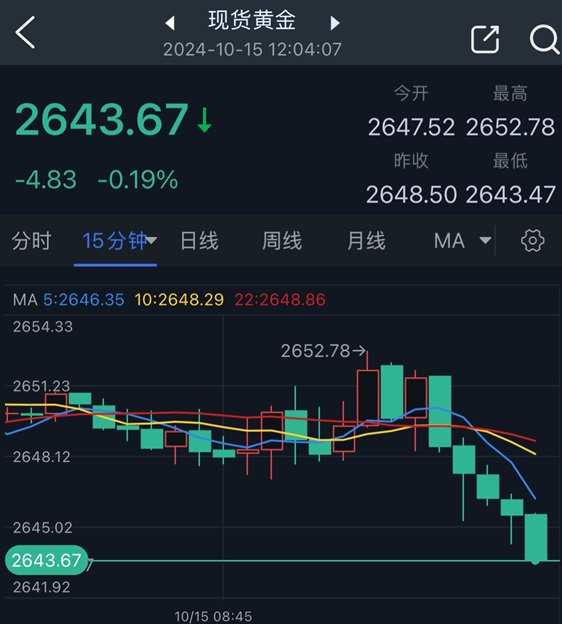
(Source: 24K99) 15-minute chart for spot gold.
Bednarik wrote that the US dollar has maintained a positive momentum early this week. Spot gold faced mild bearish pressure on Monday with signs of bulls showing signs of giving up.
 Influenced by Middle East news, gold prices softened on Monday. The Washington Post cited two informed officials on Monday, saying that Israeli Prime Minister Benjamin Netanyahu told the Biden administration that he is willing to target Iran's military facilities rather than oil or nuclear facilities.
This eased concerns about the tense situation in the Middle East, suppressing safe-haven buying of gold. As of Monday's close, spot gold fell $8.43, a decrease of 0.32%, closing at $2648.50 per ounce.
In addition, the latest news indicates that Iran is passing information to Israel through a secret channel, stating that if Israel's retaliatory actions are "limited," Iran will consider ending this round of exchange of fire between the two sides.
According to the report of the Jerusalem Post, sources revealed that Iran has been in contact with Israel through a secret channel, stating that as long as Israel's response is limited, Iran will consider this round of conflict concluded; however, the report does not specify Israel's response to this proposal.
The conflict between Iran and Israel has been going on for a long time. In the late night of October 1st, Iran launched nearly 200 missiles at Israel, leading to a further escalation of tension between the two sides. Israel immediately announced that it would launch a major retaliatory action and is currently actively planning for it.
Short-term technical outlook for gold
Bednarik stated that from a technical perspective, the gold daily chart shows that the bulls may be a bit exhausted. The momentum indicator is moving downwards, currently crossing the midline into negative territory.Relative Strength Index(RSIThe price has also turned lower but remains near overbought levels. At the same time, the gold price is developing above all its moving averages, which have a mild bullish slope. In general, the downside risk for gold seems limited, but the bulls appear to have turned cautious.
Bednarik adds that in the short term, according to the 4-hour chart,technical aspectsthe outlook is very similar. The gold price found intraday buyers near the flat 100-periodSimple Moving AverageSimple Moving Average (SMA) while the mildly bullish 20-period SMA is rising below the aforementioned longer-term averages. On the contrary, technical indicators are turning lower in the positive territory, showing uneven bearish strength. If the gold price breaks below the $2636.00/ounce area (immediate support area), the risk of further decline should increase.
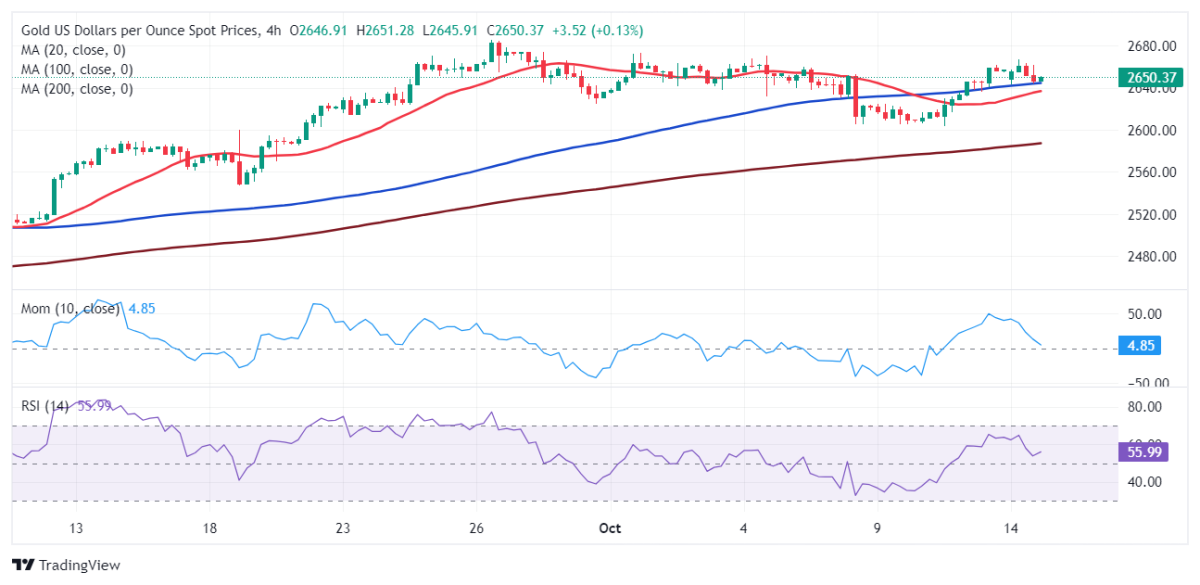
(Spot gold 4-hour chart source: FXStreet)
Bednarik gave the latest important support and resistance levels for the gold price:
Resistance: $2636.00 per troy ounce; $2625.40 per troy ounce; $2603.90 per troy ounce
Support: $2661.20 per troy ounce; $2673.10 per troy ounce; $2685.45 per troy ounce
At 12:04 Beijing time, spot gold was reported at $2643.67 per troy ounce.

