
 美联储9月会议纪要显示,绝大多数美联储官员支持大幅降息50个基点,但“一些人”更愿意降息25个基点,“这些人”本可以支持这样的决定。
#Gold Technical Analysis# 24K99 News On Thursday (October 10th) during the Asian session, spot gold maintained a moderate rebound trend intraday after a sharp fall yesterday, with the current price trading near $2611 per ounce. FXStreet Chief Analyst Valeria Bednarik wrote an analysis of the technical outlook for gold.
On Wednesday, due to the strength of the US dollar following the release of the FOMC meeting minutes, gold fell for the sixth consecutive trading day. Spot gold closed sharply lower on Wednesday, down $14.13 or 0.54% to $2607.71 per ounce. The lowest price during the trading day dropped to $2605.16 per ounce.
Bednarik wrote that gold lost its luster. Gold pressured Wednesday's low and gained downward momentum in the short term.
 The minutes of the September FOMC meeting showed that the majority of Fed officials supported a substantial 50 basis point rate cut, but "some" preferred a 25 basis point cut, which "these" could have supported.
Tai Wong, an independent metal trader in New York, stated that the sharp rise in the US dollar over the past few trading days has brought downward pressure on gold. The US dollar index hit a nearly two-month high, making dollar-denominated gold more expensive for holders of other currencies.
At 20:30 Beijing time on Thursday, the US Bureau of Labor Statistics will release the Consumer Price Index (CPI) report for September. Investors will focus on this report to further understand the outlook for US interest rates.
It is expected that the year-on-year increase in US CPI for September will drop from 2.5% to 2.3%. The month-on-month increase in CPI for September is expected to rise by 0.1%, lower than the previous 0.2% increase.
The US core CPI year-on-year increase for September is expected to remain at 3.2%; the month-on-month increase in core CPI for September is expected to drop from 0.3% to 0.2%.
FXStreet analyst Christian Borjon Valencia stated that traders' focus has now shifted to the US CPI data released on Thursday. The market estimates that inflation will continue to decrease. However, if the inflation rate is higher than expected, this will open the door for the Fed to pause its easing cycle.
UBS Group's New York-based forex strategist Vassili Serebriakovur stated: 'Ahead of the CPI release, the market will remain cautious and patient.'
Senior analyst Ipek Ozkardeskaya from UBS Group expressed: 'If Thursday's CPI data is weak enough, it may eventually help soothe the dovish tension at the Fed and prevent the US dollar from entering a mid-term bullish consolidation zone against many major currencies.'
FXStreet analyst Eren Sengezer pointed out that the month-on-month core CPI data may trigger a reaction in gold. This data does not include prices of volatile commodities and is not distorted by base effects. The market expects the core CPI to rise by 0.2% in September following a 0.3% increase in August. A reading of 0.2% or lower may put pressure on the US dollar. On the other hand, a rise of 0.5% or higher could lead investors to doubt the disinflation process, boosting the dollar and causing gold prices to turn downwards.
Short-term technical outlook for gold
Bednarik stated that the daily chart of gold shows that the price has been falling for the sixth consecutive trading day, increasing the bearish potential. Technical indicators provide a strong bearish bias, with the gold price currently trading below the bullish 20-day Simple Moving Average (SMA). Meanwhile, the 100-day SMA and 200-day SMA remain well below the current gold price level, maintaining an upward bias.
Bednarik added that in the short term, based on the 4-hour trend chart, the reasons for a bearish gold price are becoming stronger. The bearish 20-period SMA is about to fall below the broadly flat 100-period SMA, both around $2635 per ounce. At the same time, technical indicators are accelerating downwards in the negative value zone, consistent with sustained selling pressure.
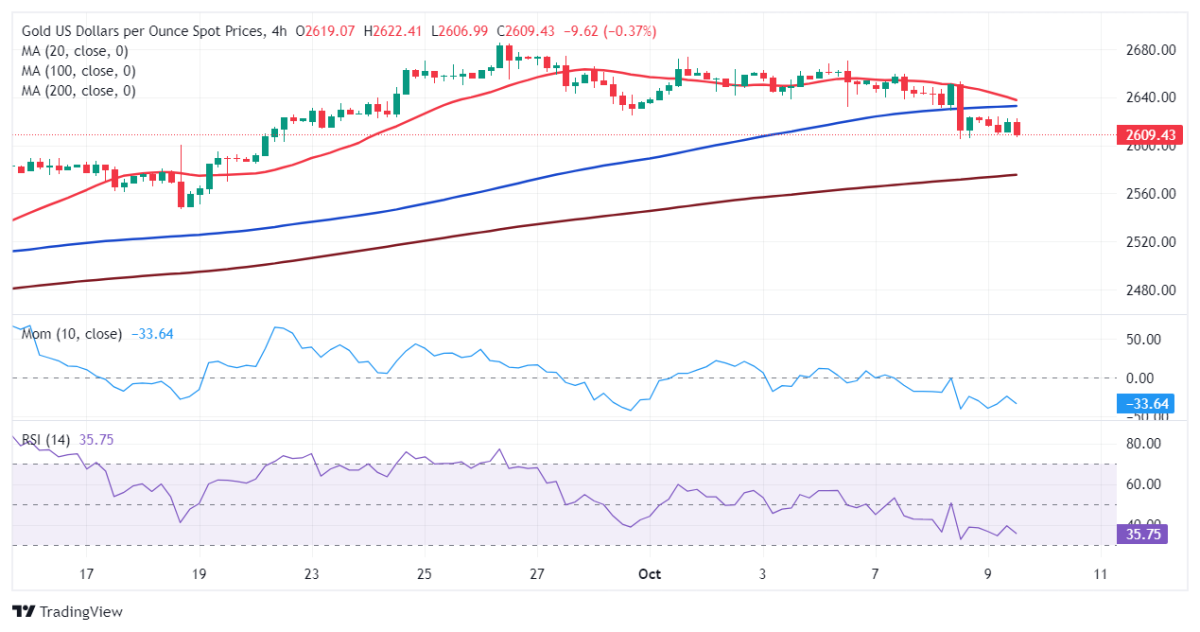
(Spot gold 4-hour chart source: FXStreet)
Bednarik gave the latest important support and resistance levels for the gold price:
Resistance: $2603.90 per ounce; $2589.10 per ounce; $2575.20 per ounce.
Support: $2625.40 per ounce; $2637.10 per ounce; $2652.90 per ounce.
At 10:30 Beijing time, spot gold was priced at $2610.77 per ounce.
