
David Iben put it well when he said, 'Volatility is not a risk we care about. What we care about is avoiding the permanent loss of capital.' It's only natural to consider a company's balance sheet when you examine how risky it is, since debt is often involved when a business collapses. Importantly, NIKE, Inc. (NYSE:NKE) does carry debt. But is this debt a concern to shareholders?
When Is Debt A Problem?
Debt assists a business until the business has trouble paying it off, either with new capital or with free cash flow. If things get really bad, the lenders can take control of the business. However, a more common (but still painful) scenario is that it has to raise new equity capital at a low price, thus permanently diluting shareholders. Of course, the upside of debt is that it often represents cheap capital, especially when it replaces dilution in a company with the ability to reinvest at high rates of return. The first thing to do when considering how much debt a business uses is to look at its cash and debt together.
What Is NIKE's Debt?
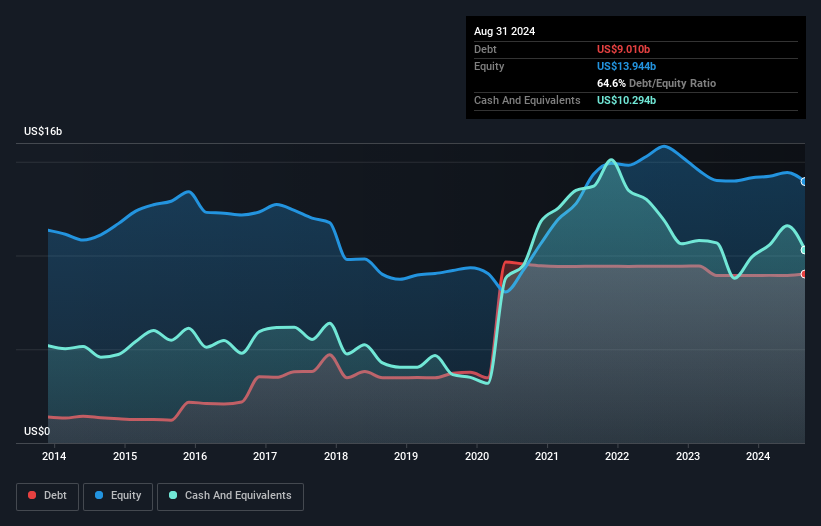
The chart below, which you can click on for greater detail, shows that NIKE had US$9.01b in debt in August 2024; about the same as the year before. But it also has US$10.3b in cash to offset that, meaning it has US$1.28b net cash.
How Healthy Is NIKE's Balance Sheet?
 According to the last reported balance sheet, NIKE had liabilities of US$10.6b due within 12 months, and liabilities of US$13.3b due beyond 12 months. On the other hand, it had cash of US$10.3b and US$4.76b worth of receivables due within a year. So it has liabilities totalling US$8.87b more than its cash and near-term receivables, combined.
Since publicly traded NIKE shares are worth a very impressive total of US$123.3b, it seems unlikely that this level of liabilities would be a major threat. Having said that, it's clear that we should continue to monitor its balance sheet, lest it change for the worse. While it does have liabilities worth noting, NIKE also has more cash than debt, so we're pretty confident it can manage its debt safely.
The good news is that NIKE has increased its EBIT by 9.2% over twelve months, which should ease any concerns about debt repayment. When analysing debt levels, the balance sheet is the obvious place to start. But ultimately the future profitability of the business will decide if NIKE can strengthen its balance sheet over time. So if you're focused on the future you can check out this free report showing analyst profit forecasts.
Finally, a company can only pay off debt with cold hard cash, not accounting profits. While NIKE has net cash on its balance sheet, it's still worth taking a look at its ability to convert earnings before interest and tax (EBIT) to free cash flow, to help us understand how quickly it is building (or eroding) that cash balance. Over the most recent three years, NIKE recorded free cash flow worth 80% of its EBIT, which is around normal, given free cash flow excludes interest and tax. This cold hard cash means it can reduce its debt when it wants to.
Summing Up
We could understand if investors are concerned about NIKE's liabilities, but we can be reassured by the fact it has has net cash of US$1.28b. And it impressed us with free cash flow of US$6.6b, being 80% of its EBIT. So we don't think NIKE's use of debt is risky. Above most other metrics, we think its important to track how fast earnings per share is growing, if at all. If you've also come to that realization, you're in luck, because today you can view this interactive graph of NIKE's earnings per share history for free.
At the end of the day, it's often better to focus on companies that are free from net debt. You can access our special list of such companies (all with a track record of profit growth). It's free.
Have feedback on this article? Concerned about the content? Get in touch with us directly. Alternatively, email editorial-team (at) simplywallst.com.
This article by Simply Wall St is general in nature. We provide commentary based on historical data and analyst forecasts only using an unbiased methodology and our articles are not intended to be financial advice. It does not constitute a recommendation to buy or sell any stock, and does not take account of your objectives, or your financial situation. We aim to bring you long-term focused analysis driven by fundamental data. Note that our analysis may not factor in the latest price-sensitive company announcements or qualitative material. Simply Wall St has no position in any stocks mentioned.