
In the ever-evolving and intensely competitive business landscape, conducting a thorough company analysis is of utmost importance for investors and industry followers. In this article, we will carry out an in-depth industry comparison, assessing Visa (NYSE:V) alongside its primary competitors in the Financial Services industry. By meticulously examining key financial metrics, market positioning, and growth prospects, we aim to offer valuable insights to investors and shed light on company's performance within the industry.
Visa Background
Visa is the largest payment processor in the world. In fiscal 2023, it processed almost $15 trillion in total volume. Visa operates in over 200 countries and processes transactions in over 160 currencies. Its systems are capable of processing over 65,000 transactions per second.
| Company | P/E | P/B | P/S | ROE | EBITDA (in billions) | Gross Profit (in billions) | Revenue Growth |
|---|---|---|---|---|---|---|---|
| Visa Inc | 29.64 | 14.06 | 16.21 | 12.62% | $6.45 | $7.13 | 9.57% |
| Mastercard Inc | 37.84 | 61.62 | 17.56 | 44.44% | $4.32 | $5.35 | 11.04% |
| Fiserv Inc | 31.89 | 3.75 | 5.55 | 3.14% | $2.22 | $3.12 | 7.38% |
| PayPal Holdings Inc | 18.76 | 3.83 | 2.68 | 5.46% | $1.75 | $3.61 | 8.21% |
| Fidelity National Information Services Inc | 82.88 | 2.68 | 4.86 | 1.39% | $0.8 | $0.95 | 2.68% |
| Block Inc | 60.78 | 2.09 | 1.76 | 1.02% | $0.6 | $2.23 | 11.21% |
| Global Payments Inc | 18.02 | 1.12 | 2.57 | 1.68% | $1.08 | $1.63 | 4.74% |
| Corpay Inc | 23.18 | 8.05 | 6.12 | 8.38% | $0.51 | $0.77 | 2.9% |
| Jack Henry & Associates Inc | 35.10 | 7.26 | 6.05 | 5.58% | $0.18 | $0.23 | 4.73% |
| WEX Inc | 35.67 | 4.75 | 3.33 | 4.32% | $0.25 | $0.41 | 8.4% |
| Shift4 Payments Inc | 54.07 | 8.51 | 1.99 | 5.7% | $0.13 | $0.23 | 29.83% |
| Euronet Worldwide Inc | 16.84 | 3.57 | 1.26 | 6.76% | $0.18 | $0.41 | 5.02% |
| The Western Union Co | 7.12 | 8.95 | 0.97 | 33.62% | $0.24 | $0.4 | -8.85% |
| StoneCo Ltd | 10.08 | 1.21 | 1.55 | 3.29% | $1.13 | $2.25 | 11.86% |
| Payoneer Global Inc | 29.54 | 4.38 | 3.28 | 4.87% | $0.06 | $0.2 | 15.86% |
| PagSeguro Digital Ltd | 7.61 | 0.99 | 1.53 | 3.59% | $1.83 | $-0.02 | 6.74% |
| DLocal Ltd | 19.68 | 5.58 | 3.71 | 10.06% | $0.06 | $0.07 | 6.29% |
| Paymentus Holdings Inc | 76.23 | 5.46 | 3.59 | 2.1% | $0.02 | $0.06 | 32.55% |
| Evertec Inc | 31.97 | 4.44 | 2.82 | 6.44% | $0.09 | $0.11 | 26.88% |
| Average | 33.18 | 7.68 | 3.95 | 8.44% | $0.86 | $1.22 | 10.41% |
After a detailed analysis of Visa, the following trends become apparent:
 The stock's Price to Earnings ratio of 29.64 is lower than the industry average by 0.89x, suggesting potential value in the eyes of market participants.
The elevated Price to Book ratio of 14.06 relative to the industry average by 1.83x suggests company might be overvalued based on its book value.
With a relatively high Price to Sales ratio of 16.21, which is 4.1x the industry average, the stock might be considered overvalued based on sales performance.
With a Return on Equity (ROE) of 12.62% that is 4.18% above the industry average, it appears that the company exhibits efficient use of equity to generate profits.
The Earnings Before Interest, Taxes, Depreciation, and Amortization (EBITDA) of $6.45 Billion is 7.5x above the industry average, highlighting stronger profitability and robust cash flow generation.
The company has higher gross profit of $7.13 Billion, which indicates 5.84x above the industry average, indicating stronger profitability and higher earnings from its core operations.
The company's revenue growth of 9.57% is significantly lower compared to the industry average of 10.41%. This indicates a potential fall in the company's sales performance.
Debt To Equity Ratio
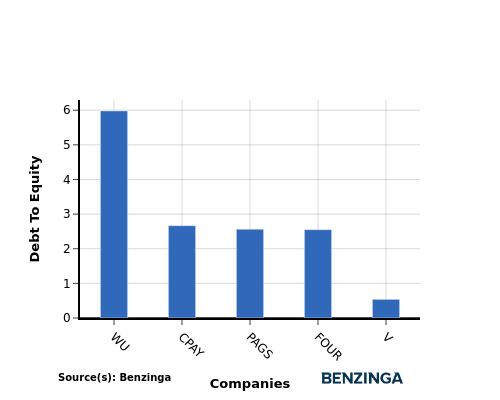
The debt-to-equity (D/E) ratio helps evaluate the capital structure and financial leverage of a company.
Considering the debt-to-equity ratio in industry comparisons allows for a concise evaluation of a company's financial health and risk profile, aiding in informed decision-making.
When examining Visa in comparison to its top 4 peers with respect to the Debt-to-Equity ratio, the following information becomes apparent:
Visa demonstrates a stronger financial position compared to its top 4 peers in the sector.
With a lower debt-to-equity ratio of 0.54, the company relies less on debt financing and maintains a healthier balance between debt and equity, which can be viewed positively by investors.
Key Takeaways
For Visa, the PE ratio is low compared to peers, indicating potential undervaluation. The high PB and PS ratios suggest strong market sentiment and revenue multiples. In terms of ROE, EBITDA, and gross profit, Visa demonstrates high profitability and operational efficiency. However, the low revenue growth may raise concerns about future performance relative to industry peers in the Financial Services sector.
This article was generated by Benzinga's automated content engine and reviewed by an editor.
