
Diversification is a key tool for dealing with stock price volatility. But if you're going to beat the market overall, you need to have individual stocks that outperform. Universal Display Corporation (NASDAQ:OLED) has done well over the last year, with the stock price up 35% beating the market return of 33% (not including dividends). The longer term returns have not been as good, with the stock price only 27% higher than it was three years ago.
Now it's worth having a look at the company's fundamentals too, because that will help us determine if the long term shareholder return has matched the performance of the underlying business.
While the efficient markets hypothesis continues to be taught by some, it has been proven that markets are over-reactive dynamic systems, and investors are not always rational. One way to examine how market sentiment has changed over time is to look at the interaction between a company's share price and its earnings per share (EPS).
 During the last year Universal Display grew its earnings per share (EPS) by 7.0%. This EPS growth is significantly lower than the 35% increase in the share price. This indicates that the market is now more optimistic about the stock.
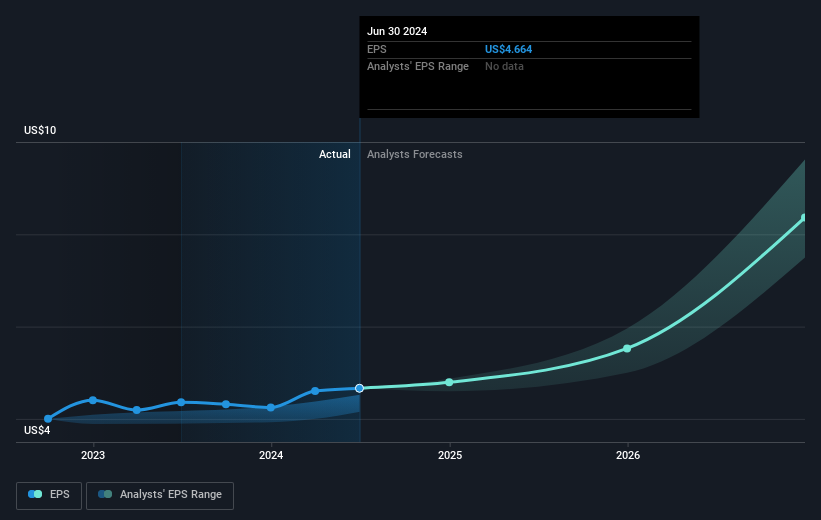
The image below shows how EPS has tracked over time (if you click on the image you can see greater detail).
It's good to see that there was some significant insider buying in the last three months. That's a positive. On the other hand, we think the revenue and earnings trends are much more meaningful measures of the business. This free interactive report on Universal Display's earnings, revenue and cash flow is a great place to start, if you want to investigate the stock further.
A Different Perspective
Universal Display's TSR for the year was broadly in line with the market average, at 36%. Most would be happy with a gain, and it helps that the year's return is actually better than the average return over five years, which was 6%. It is possible that management foresight will bring growth well into the future, even if the share price slows down. It's always interesting to track share price performance over the longer term. But to understand Universal Display better, we need to consider many other factors. To that end, you should be aware of the 1 warning sign we've spotted with Universal Display .
There are plenty of other companies that have insiders buying up shares. You probably do not want to miss this free list of undervalued small cap companies that insiders are buying.
Please note, the market returns quoted in this article reflect the market weighted average returns of stocks that currently trade on American exchanges.
Have feedback on this article? Concerned about the content? Get in touch with us directly. Alternatively, email editorial-team (at) simplywallst.com.
This article by Simply Wall St is general in nature. We provide commentary based on historical data and analyst forecasts only using an unbiased methodology and our articles are not intended to be financial advice. It does not constitute a recommendation to buy or sell any stock, and does not take account of your objectives, or your financial situation. We aim to bring you long-term focused analysis driven by fundamental data. Note that our analysis may not factor in the latest price-sensitive company announcements or qualitative material. Simply Wall St has no position in any stocks mentioned.