
Key Insights
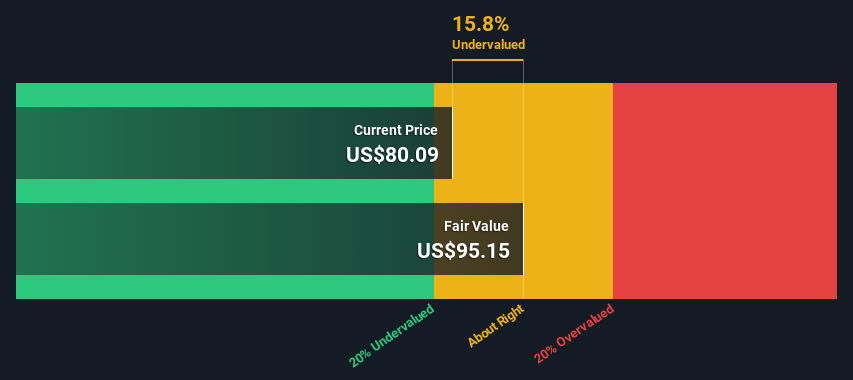
- Using the 2 Stage Free Cash Flow to Equity, H.B. Fuller fair value estimate is US$95.15
- Current share price of US$80.09 suggests H.B. Fuller is potentially trading close to its fair value
- Our fair value estimate is 10% higher than H.B. Fuller's analyst price target of US$86.50
Does the September share price for H.B. Fuller Company (NYSE:FUL) reflect what it's really worth? Today, we will estimate the stock's intrinsic value by taking the expected future cash flows and discounting them to their present value. This will be done using the Discounted Cash Flow (DCF) model. It may sound complicated, but actually it is quite simple!
We generally believe that a company's value is the present value of all of the cash it will generate in the future. However, a DCF is just one valuation metric among many, and it is not without flaws. If you still have some burning questions about this type of valuation, take a look at the Simply Wall St analysis model.
Step By Step Through The Calculation
We use what is known as a 2-stage model, which simply means we have two different periods of growth rates for the company's cash flows. Generally the first stage is higher growth, and the second stage is a lower growth phase. To begin with, we have to get estimates of the next ten years of cash flows. Where possible we use analyst estimates, but when these aren't available we extrapolate the previous free cash flow (FCF) from the last estimate or reported value. We assume companies with shrinking free cash flow will slow their rate of shrinkage, and that companies with growing free cash flow will see their growth rate slow, over this period. We do this to reflect that growth tends to slow more in the early years than it does in later years.
 A DCF is all about the idea that a dollar in the future is less valuable than a dollar today, so we discount the value of these future cash flows to their estimated value in today's dollars:
10-year free cash flow (FCF) estimate
| 2025 | 2026 | 2027 | 2028 | 2029 | 2030 | 2031 | 2032 | 2033 | 2034 | |
| Levered FCF ($, Millions) | US$226.3m | US$262.7m | US$267.0m | US$272.1m | US$277.7m | US$283.8m | US$290.3m | US$297.2m | US$304.3m | US$311.7m |
| Growth Rate Estimate Source | Analyst x3 | Analyst x2 | Est @ 1.64% | Est @ 1.90% | Est @ 2.08% | Est @ 2.20% | Est @ 2.29% | Est @ 2.36% | Est @ 2.40% | Est @ 2.43% |
| Present Value ($, Millions) Discounted @ 7.3% | US$211 | US$228 | US$216 | US$205 | US$195 | US$186 | US$177 | US$169 | US$161 | US$154 |
("Est" = FCF growth rate estimated by Simply Wall St)
Present Value of 10-year Cash Flow (PVCF) = US$1.9b
After calculating the present value of future cash flows in the initial 10-year period, we need to calculate the Terminal Value, which accounts for all future cash flows beyond the first stage. The Gordon Growth formula is used to calculate Terminal Value at a future annual growth rate equal to the 5-year average of the 10-year government bond yield of 2.5%. We discount the terminal cash flows to today's value at a cost of equity of 7.3%.
Terminal Value (TV)= FCF2034 × (1 + g) ÷ (r – g) = US$312m× (1 + 2.5%) ÷ (7.3%– 2.5%) = US$6.7b
Present Value of Terminal Value (PVTV)= TV / (1 + r)10= US$6.7b÷ ( 1 + 7.3%)10= US$3.3b
The total value, or equity value, is then the sum of the present value of the future cash flows, which in this case is US$5.2b. In the final step we divide the equity value by the number of shares outstanding. Relative to the current share price of US$80.1, the company appears about fair value at a 16% discount to where the stock price trades currently. Valuations are imprecise instruments though, rather like a telescope - move a few degrees and end up in a different galaxy. Do keep this in mind.
The Assumptions
The calculation above is very dependent on two assumptions. The first is the discount rate and the other is the cash flows. Part of investing is coming up with your own evaluation of a company's future performance, so try the calculation yourself and check your own assumptions. The DCF also does not consider the possible cyclicality of an industry, or a company's future capital requirements, so it does not give a full picture of a company's potential performance. Given that we are looking at H.B. Fuller as potential shareholders, the cost of equity is used as the discount rate, rather than the cost of capital (or weighted average cost of capital, WACC) which accounts for debt. In this calculation we've used 7.3%, which is based on a levered beta of 1.164. Beta is a measure of a stock's volatility, compared to the market as a whole. We get our beta from the industry average beta of globally comparable companies, with an imposed limit between 0.8 and 2.0, which is a reasonable range for a stable business.
SWOT Analysis for H.B. Fuller
- Earnings growth over the past year exceeded the industry.
- Dividends are covered by earnings and cash flows.
- Dividend information for FUL.
- Interest payments on debt are not well covered.
- Dividend is low compared to the top 25% of dividend payers in the Chemicals market.
- Annual earnings are forecast to grow for the next 3 years.
- Current share price is below our estimate of fair value.
- Debt is not well covered by operating cash flow.
- Annual earnings are forecast to grow slower than the American market.
- Is FUL well equipped to handle threats?
Looking Ahead:
Although the valuation of a company is important, it is only one of many factors that you need to assess for a company. It's not possible to obtain a foolproof valuation with a DCF model. Rather it should be seen as a guide to "what assumptions need to be true for this stock to be under/overvalued?" If a company grows at a different rate, or if its cost of equity or risk free rate changes sharply, the output can look very different. For H.B. Fuller, we've compiled three pertinent factors you should further examine:
- Risks: We feel that you should assess the 1 warning sign for H.B. Fuller we've flagged before making an investment in the company.
- Future Earnings: How does FUL's growth rate compare to its peers and the wider market? Dig deeper into the analyst consensus number for the upcoming years by interacting with our free analyst growth expectation chart.
- Other High Quality Alternatives: Do you like a good all-rounder? Explore our interactive list of high quality stocks to get an idea of what else is out there you may be missing!
PS. Simply Wall St updates its DCF calculation for every American stock every day, so if you want to find the intrinsic value of any other stock just search here.
Have feedback on this article? Concerned about the content? Get in touch with us directly. Alternatively, email editorial-team (at) simplywallst.com.
This article by Simply Wall St is general in nature. We provide commentary based on historical data and analyst forecasts only using an unbiased methodology and our articles are not intended to be financial advice. It does not constitute a recommendation to buy or sell any stock, and does not take account of your objectives, or your financial situation. We aim to bring you long-term focused analysis driven by fundamental data. Note that our analysis may not factor in the latest price-sensitive company announcements or qualitative material. Simply Wall St has no position in any stocks mentioned.
