
Steel Dynamics' (NASDAQ:STLD) stock is up by a considerable 5.4% over the past month. Since the market usually pay for a company's long-term fundamentals, we decided to study the company's key performance indicators to see if they could be influencing the market. In this article, we decided to focus on Steel Dynamics' ROE.
ROE or return on equity is a useful tool to assess how effectively a company can generate returns on the investment it received from its shareholders. In short, ROE shows the profit each dollar generates with respect to its shareholder investments.
How To Calculate Return On Equity?
Return on equity can be calculated by using the formula:
 Return on Equity = Net Profit (from continuing operations) ÷ Shareholders' Equity
So, based on the above formula, the ROE for Steel Dynamics is:
22% = US$2.0b ÷ US$9.1b (Based on the trailing twelve months to June 2024).
The 'return' is the income the business earned over the last year. So, this means that for every $1 of its shareholder's investments, the company generates a profit of $0.22.
What Is The Relationship Between ROE And Earnings Growth?
So far, we've learned that ROE is a measure of a company's profitability. Depending on how much of these profits the company reinvests or "retains", and how effectively it does so, we are then able to assess a company's earnings growth potential. Generally speaking, other things being equal, firms with a high return on equity and profit retention, have a higher growth rate than firms that don't share these attributes.
Steel Dynamics' Earnings Growth And 22% ROE
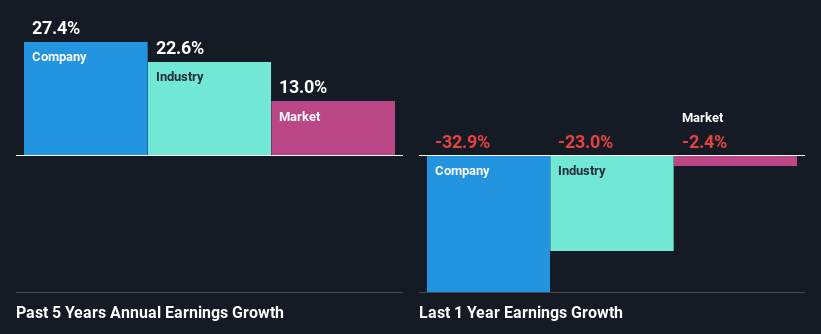
To start with, Steel Dynamics' ROE looks acceptable. Especially when compared to the industry average of 9.4% the company's ROE looks pretty impressive. Probably as a result of this, Steel Dynamics was able to see an impressive net income growth of 27% over the last five years. However, there could also be other causes behind this growth. For instance, the company has a low payout ratio or is being managed efficiently.
As a next step, we compared Steel Dynamics' net income growth with the industry, and pleasingly, we found that the growth seen by the company is higher than the average industry growth of 23%.
The basis for attaching value to a company is, to a great extent, tied to its earnings growth. It's important for an investor to know whether the market has priced in the company's expected earnings growth (or decline). This then helps them determine if the stock is placed for a bright or bleak future. If you're wondering about Steel Dynamics''s valuation, check out this gauge of its price-to-earnings ratio, as compared to its industry.
Is Steel Dynamics Using Its Retained Earnings Effectively?
Steel Dynamics has a really low three-year median payout ratio of 8.9%, meaning that it has the remaining 91% left over to reinvest into its business. This suggests that the management is reinvesting most of the profits to grow the business as evidenced by the growth seen by the company.
Additionally, Steel Dynamics has paid dividends over a period of at least ten years which means that the company is pretty serious about sharing its profits with shareholders. Our latest analyst data shows that the future payout ratio of the company is expected to rise to 17% over the next three years. Accordingly, the expected increase in the payout ratio explains the expected decline in the company's ROE to 15%, over the same period.
Summary
Overall, we are quite pleased with Steel Dynamics' performance. Specifically, we like that the company is reinvesting a huge chunk of its profits at a high rate of return. This of course has caused the company to see substantial growth in its earnings. With that said, on studying the latest analyst forecasts, we found that while the company has seen growth in its past earnings, analysts expect its future earnings to shrink. To know more about the latest analysts predictions for the company, check out this visualization of analyst forecasts for the company.
Have feedback on this article? Concerned about the content? Get in touch with us directly. Alternatively, email editorial-team (at) simplywallst.com.
This article by Simply Wall St is general in nature. We provide commentary based on historical data and analyst forecasts only using an unbiased methodology and our articles are not intended to be financial advice. It does not constitute a recommendation to buy or sell any stock, and does not take account of your objectives, or your financial situation. We aim to bring you long-term focused analysis driven by fundamental data. Note that our analysis may not factor in the latest price-sensitive company announcements or qualitative material. Simply Wall St has no position in any stocks mentioned.