

Source: CICC Insight Authors: Liu Gang, Wang Muyao, Wang Zilin
After last week's stunning retaliatory rebound and the market sentiment significantly excited, even 'overbought', we will focus on answering the following questions in this article:
1. What is the core change of this round of policies? Directly encouraging the stock market and real estate, emphasizing different policy approaches for consumer livelihood and consumption transmission;
 2. How much is enough for the policies? Fiscal policy remains critical, interest rate cuts of 45-70 basis points, fiscal expansion of 7-8 trillion can reverse the yield curve inversion;
3. How much room does the market have left? The current sentiment included is comparable to the peak in May, if sentiment returns to the 2023 peak, corresponding to 22500 points in the Hang Seng Index;
4. Who is buying? Are foreign funds returning? Trading and passive funds lead, long-term active foreign funds have not yet returned in large scale;
5. Direction for short-term speculation and long-term allocation? Short-term below 1x PB and lagging sectors. Fiscal efforts shift towards cyclical and core assets. Otherwise, focus on technology growth, internet-related, export chains, and local stocks.
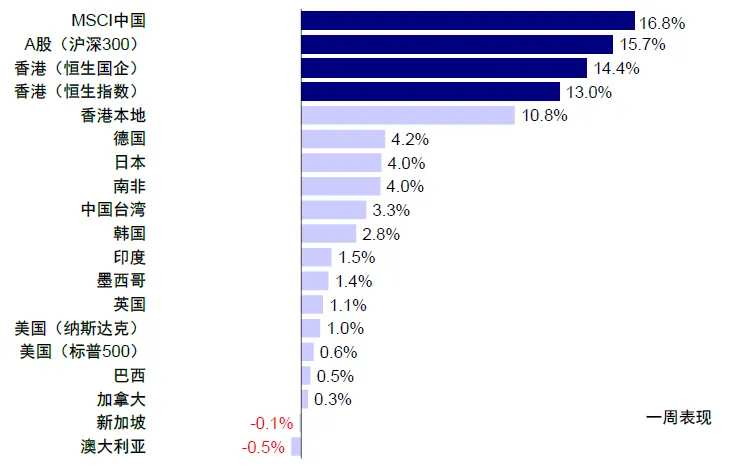
In the last week of September, the policies of the three financial commissions and the Central Political Bureau meeting boosted market sentiment beyond expectations, A-shares and Hong Kong stocks saw a strong rebound, leading the global markets. The Shanghai Composite Index surged by 12.8%, marking the largest weekly gain since the end of 2008, reclaiming the 3,000-point level; the Hong Kong stock market showed even greater resilience, with the Hang Seng Index closing up by 13.0%, marking the largest single-week gain since 2000, surpassing 20,000 points. H-shares and the MSCI China Index rose by 14.4% and 16.8% respectively, while the Hang Seng Tech Index surged by 20.2%.
The soaring sentiment drove the trading volume of both markets to a new high. On Friday, the trading volume of the Hong Kong stock main board exceeded 400 billion Hong Kong dollars, hitting a historical high. The trading volume of A-shares also reached 1.46 trillion RMB, the highest since September 2021. At the sector level, real estate (+34.1%) and diversified finance (+25.5%) led the gains directly benefiting from positive policy expectations. Food retail (+27.1%), food & beverage (+25.3%), retail (+24.0%), insurance (+23.5%), and internet-related sectors (+20.6%) also performed well. Meanwhile, traditional high dividend sectors such as telecommunications (+1.1%), banks (+8.8%), and energy (+9.6%) lagged behind.
At the opening today, the Hong Kong and A-share markets continued the hot sentiment. By midday, the A-share Chinext Price Index surged over 11% to surpass 2100 points, with a total trading volume exceeding 1.66 trillion yuan in both markets. The Hang Seng Index in Hong Kong rose by 3.34%, while the Hang Seng Tech Index surged by 7.12%.
Chart: Strong rebound in the A-share and Hong Kong stock markets
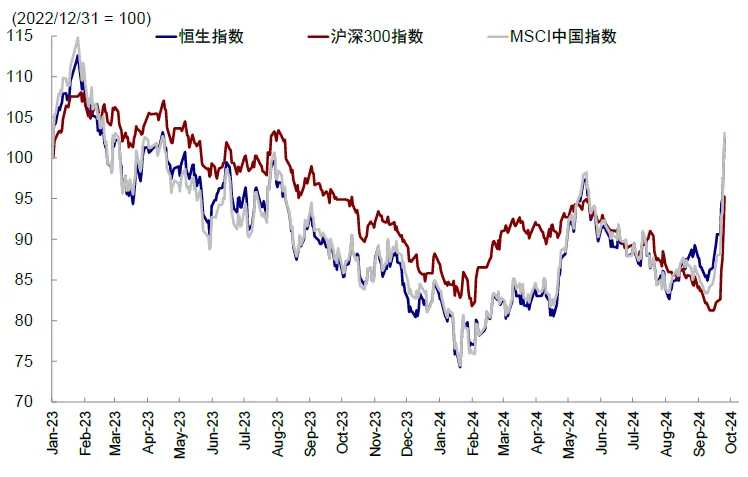
Chart: China market leading the global markets
Several points of information that we have been continuously conveying to the market recently have been basically confirmed:
1) Hong Kong stocks have greater resilience because of better earnings, more thorough clearing of valuations and positions.
2) Hong Kong stocks are more sensitive to the Fed rate cuts. We estimate that solely relying on the Fed rate cuts and risk premium returning to the 5-year average, the Hang Seng Index is expected to reach 19,500-20,500, and it has already reached the upper limit of this range.
3) It is recommended to focus on interest rate-sensitive growth stocks, the export chain driven by U.S. real estate demand, local dividends and real estate in the Hong Kong stock market, all showing greater resilience in this round of gains.
However, the fear of missing out (FOMO) has led to emotions being very quickly accounted for, even with multipletechnical indicatorsoverextended in the short term. For example, the Hang Seng Index on the 6th of the currentRSI(Relative Strength Index) has reached 96.5, the highest since the end of 2018, and the SSE Composite Index also reached 94.1, indicating a short-term 'overbought' condition. However, unlike the past, short selling in the Hong Kong stock market has increased along with the market rally, and the short selling ratio has also temporarily risen, indicating that there are still differing views on the market's future trend. So, after the significant gains in the past week, how much further upside potential is there? Which sectors are recommended for allocation? How should we view the impact of the new round of policies, and how much of it has been factored into the market expectations? Which funds are the main players buying into?
Q1. What are the core changes in this round of policies? Encouraging leverage in the private sector (stock market and real estate), emphasizing more on people's livelihoods and consumer signals and perspectives.
In several previous reports, we analyzed the root cause of China's current growth and inflation pressure issues from the perspective of the credit cycle. It is a sustained credit contraction, especially the continuous deleveraging in the private sector, which should have been hedged by the slow and small credit expansion by the government sector. There are two reasons for this situation:
1)return on investmentExpectations are too low, directly reflected in the decline in asset prices, especially the sluggish prices of real estate and stocks.
2) The financing costs are still not low enough, especially the real interest rates after deducting the price factor, which may even be higher than the substantial rate hikes in the USA.
The financial policy 'combination punch' on September 24th and the Politburo meeting on September 26th, along with the consecutive policy adjustments and statements, all revolve around the reduction of financing costs (lowering multiple interest rates) and boosting investment return expectations (stabilizing house prices and providing liquidity support to the stock market). We believe that the core of this round of policy changes, as well as the reason for the positive market response, are: first, directly encouraging leverage in the private sector (stock market and real estate) through numerous financial policies, and second, emphasizing more on people's livelihoods and consumption, conveying different signals and perspectives compared to the past.
On the one hand, continue to promote the reduction of financing costs and leverage thresholds. Specific policy measures include:
1) Cut interest rates by 20bp, reduce the 7-day reverse repurchase operation rate by 20bp, from 1.7% to 1.5%, and there is a high probability of a 20bp simultaneous decrease in the October LPR. The proportion of housing mortgages in resident credit is the highest (75%), while corporate financing is mainly through indirect financing (70%). Whether it is the resident mortgage rate or the corporate loan rate, they are closely related to the LPR. We calculate that the current resident's new mortgage rate (3.35%) is higher than the investment return measured by the rental yield in first-tier cities (approximately 1.74%), and the weighted average interest rate of corporate loans (3.63%) is higher than the corporate ROA level (2.87%). The adjustment of LPR helps to reduce the financing costs for residents and enterprises.
2) Reduce the down payment ratio to 15%, unify the down payment ratio for first-time and second-time homebuyers, and reduce the down payment ratio for second-time homebuyers from 25% to 15%, lowering the threshold for resident mortgage loans.
3) Reduce the existing mortgage rates to the levels of new loans, with an average reduction of 50 basis points. PBOC Governor said it is expected to help an average of 50 million families reduce interest expenses by 3,000 yuan per year, while also easing the pressure on residents to repay loans early.
4) Lower the reserve requirement ratio by 50bp and provide 1 trillion yuan in long-term liquidity. Depending on the liquidity situation, there may be a further reduction of 25-50bp in the future.
On the other hand, focusing on stabilizing asset prices and investment return expectations. The overall interest rate and reserve requirement ratio reduction policies continue the previous loose approach, and the magnitude is generally within expectations. The incremental change that exceeds expectations lies in stabilizing asset prices and investment return expectations, reflected in policy innovation and target expressions:
1) The central bank has introduced two new structural monetary policy tools to stabilize stock market prices. One is the Securities Fund Insurance Company Swap Facility, encouraging non-bank financial institutions to invest in the stock market with leverage. The initial operation scale is 500 billion yuan, with a possible subsequent addition of 500-1000 billion yuan. The other tool is the Special Re-lending for Share Buybacks and Incremental Holdings, with an interest rate of only 2.25%. This move injects incremental funds into the stock market, with an initial quota of 300 billion yuan, which may be increased to 300-600 billion yuan.
2) Targeted statements explicitly stabilize property prices. The Politburo meeting mentioned for the first time a clear targeted statement of 'promoting the stabilization of the real estate market to prevent it from falling', greatly exceeding market expectations. Policies on both demand and supply sides of real estate may be accelerated.
In addition, the Political Bureau meeting expressed a different train of thought and signal regarding fiscal policy, as well as the emphasis on people's livelihood and consumer areas, which, if implemented, will have a greater impact. The most unexpected expression in the meeting communique is the focus on consumer and people's livelihood, stating "to combine promoting consumption and benefiting people's livelihood, and promoting income growth for middle and low-income groups." In terms of fiscal policy deployment, it was proposed to increase the countercyclical adjustment intensity of fiscal policy, ensure necessary fiscal expenditures; to issue and use ultra-long-term special government bonds and local government special bonds well, and better leverage the role of government investment driving. Market expectations suggest the possibility of a strengthened fiscal policy, especially in areas with higher fiscal multipliers such as demand-side and resident-side sectors.
What are the expectations for Q2 and beyond, and how significant are the policies? We statically calculated a 45-70 basis point interest rate cut and a fiscal expansion of 7-8 trillion yuan, which is expected to reverse the yield curve inversion.
The positive change in policy thinking is very important, but what is more crucial is the fundamental means that bring about this change, namely fiscal policy. Is the pace fast enough, and is the intensity sufficient? Otherwise, it may be difficult to find clear support after being driven by emotions and liquidity.
Based on this consideration, starting from the difference between investment return rates and funding costs mentioned above, we update the calculation to determine how significant a policy effort is needed to address this yield curve inversion problem. It should be noted that this calculation is only based on a static perspective, with strong assumptions, and is intended to provide investors with a reference for observing the policy effort. Specifically,
A 45-70 basis point interest rate cut can address the issue of high funding costs. Our static calculation shows that a 5-year LPR (likely to fall to 3.65% in October) further decreasing by 45-70 basis points to 2.95%-3.2% would help solve the current problem where investment returns are lower than funding costs: 1) In terms of residential real estate investment, to align mortgage rates (3.35%, likely to decrease to 3.15% in October) with the rental return in first-tier cities (1.74%), a drop of approximately 140 basis points in mortgage rates is needed. Based on the historical relationship between mortgage rates and the 5-year LPR, this corresponds to a downward adjustment of approximately 45-70 basis points; 2) In terms of corporate investment, for financial institutions and enterprise loans, the weighted average interest rate (3.63%, likely to decrease to 3.43% in October) compared to the ROA of A-share non-financial listed companies (2.87%) needs to decline by 60 basis points. Considering that small and medium-sized enterprises may face higher private borrowing costs and weaker profit-making ability, a greater decline in the benchmark interest rate may be necessary to meet the needs.
Chart: Intensive issuance of policies, unexpected strength in stabilizing growth and market confidence

Chart: Mortgage rate (3.35%, likely to decrease to 3.15% in October) higher than rental yield in first-tier cities (1.74%).

Chart: Weighted average interest rate for corporate loans (3.63%, likely to decrease to 3.43% in October) higher than ROA of A-share non-financial listed enterprises (2.87%).

► Fiscal increment of 7-8 trillion yuan may boost investment return expectations. Compared to interest rate cuts that lead to widespread decline in various private sector financing costs, what is more crucial is boosting the return on investment. Otherwise, a single monetary easing measure can lead to a "liquidity trap" where even though financing costs drop rapidly, private sector reluctance to "leverage up" due to lower investment return expectations will persist. This highlights the necessity for fiscal efforts.
The current fiscal scale and pace both need to be strengthened. From the fiscal pulse perspective, although it rose to 1.4% in July due to base effects, it weakened again in August and still lags behind the historical peak (4%). If expenditures are based on the deficit rate at the Two Sessions, special treasury bond and government special bond arrangements, our calculation suggests that the general fiscal deficit pulse may decrease to 0.4% by the end of the year. To bring the fiscal pulse back to historical highs or to increase the overall social financing growth rate from the current 8.1% to the early 2023 level of 10%, our updated calculation indicates the need for an additional issuance of 7-8 trillion yuan.
Chart: If next year the broad fiscal deficit pulses back to the historical high point (4%), corresponding to an expansion of the broad deficit scale by 5-6 trillion yuan.

Chart: The private sector's social financing growth rate has declined significantly, while the credit expansion by the government sector has not been able to provide sufficient hedging.

Chart: The social financing growth rate is restored to 10% during the year (at the beginning of 2023), requiring an additional issuance scale of 7-8 trillion yuan.

From this perspective, there is still a gap in current market expectations. The market expects that there may be a certain scale of fiscal stimulus in the near future to address the pressure of low inflation and weak domestic demand in the right direction, but it may be difficult to offset the continuous downward trend in private credit. In addition, the speed of fiscal efforts is particularly important. In May of this year, we estimated the need to increase the issuance size by 4-5 trillion yuan, but the progress of fiscal issuance and expenditure is slow. Against the background of accelerated private credit contraction, the required incremental scale further expands.
Therefore, the key points for subsequent observation are: 1) the strength and speed of fiscal efforts; 2) the specific terms and details of two innovative financial tools that directly encourage leveraging in the private sector stock market, as well as the status of fund allocation.
Q3, how much expectation has been factored into the market, and how much room is left? Optimism has approached the level of May this year, reaching around 22,500 for the Hang Seng Index, equivalent to early 2023 sentiment.
Compared to the market sentiment 'racing ahead,' risk-free interest rates are relatively fixed while profits react more slowly. Therefore, the equity risk premium has become the best indicator to depict short-term market expectations, whether it is optimistic policy expectations or direct liquidity injections.
During the week of September 29th, the 16.8% increase in the MSCI Chinese Index was mainly contributed by the decline in equity risk premium, with risk-free interest rates not decreasing but rising, and EPS contributing only slightly. The Hang Seng Index's risk premium has rapidly fallen from a high point of 9.5% on September 11th to 7.3%, close to the historical average since 2018 and the lowest since June 2024. Roughly speaking, the current level of optimistic sentiment is similar to the late May market peak, but may still not be at the level of early 2023 sentiment.
Chart: Rapid repair of the risk premium has been the main contribution to the rebound in this round of the market.

Chart: Hang Seng Index risk premium falls to 7.4%.

How much room is there for follow-up? Assuming that the risk-free rate remains unchanged in the short term in China and the USA, and profit improvement is still awaited: 1) If the risk premium falls to 6.7% at the market high point in May 2024, or supports the Hang Seng Index to around 21,000 points; 2) If sentiment continues to improve to 6.1% corresponding to the high point after the easing of the epidemic at the beginning of 2023, the Hang Seng Index may reach around 22,500 points. Based on this, a greater space would require profit recovery under fiscal efforts. Currently, we calculate a 2-3% full-year profit growth from the bottom up for 2024. If profit growth can be restored to 10%, the Hang Seng Index level may reach around 24,000 points.
Chart: Risk premium falls to the low point in May or supports the Hang Seng Index to reach around 21,000 points, with more significant space requiring profit recovery.

The short-term market has incorporated expectations quite fully. On the one hand, the risk premium has rapidly declined, and on the other hand, technical indicators also show a potential "overbought" situation in the short term: 1) The 6-day RSI of the Hang Seng Index has reached 96.5, the highest since the end of 2018, while the Shanghai Composite Index has also reached 94.1, the highest since the end of 2020. 2) During the rebound, the proportion of short selling transactions in Hong Kong and Mainland stocks has increased, with the scale of short selling transactions continuing to grow. The current short selling ratio in Hong Kong stocks averages 17.5% over 5 days, an increase from last week's 15.6%. Historically, the ratio of short selling tends to move inversely with the market, so when they move in the same direction, it may indicate a divergence in market views and emphasize the importance of subsequent fundamentals and policy developments for market trends.
Chart: Hang Seng Index relative strength index (RSI) reached 96.5 over 6 days.

Chart: Shanghai Composite Index relative strength index (RSI) reached 94.1 over 6 days.

Chart: Short selling ratio and market trends usually exhibit a negative correlation, but there have been instances in the past where the market rose while the short selling ratio increased from a low point.

Who are the main buyers in Q4? Trading and passive funds dominate, with long-term foreign capital not yet flowing in significantly, while some profits are being taken by southbound funds.
The nature of the capital inflow during the rise also has a significant impact on the sustainability of the subsequent rebound. We have integrated various data sources (EPFR, Stock Connect, etc.) and combined customer feedback to find:
1) Long-term foreign capital has not yet flowed in significantly. We have previously analyzed the composition of foreign capital and observation methods in detail. The active funds of EPFR can serve as an important window to depict long-term institutional investors (Long Only), with outflows continuing in the week of September 29. At the same time, feedback from customers largely validates this point, indicating that long-term foreign investors are more focused on reducing underweight positions to avoid significant underperformance, rather than significantly increasing holdings.
2) Trading and passive funds may be predominant. Trading funds such as hedge funds act more quickly and flexibly, similar to the situation during the sharp rise of Hong Kong stocks in April and May. As mentioned earlier, short selling increased significantly during the market rally, indicating the long and short game of funds. In addition, there has been a sharp increase in passive funds flowing into EPFR, which may reflect more non-institutional investor behavior and also explain the surge in the stocks of index heavyweights.
3) Southbound fund inflows have narrowed or even turned into outflows, with some leading southbound targets that have performed well experiencing overall net selling, suggesting profit taking or portfolio adjustments.
Reviewing historical experiences, trading and passive funds tend to flow in early in the rebound due to their flexibility, but there is also an issue of weak sustainability. A prime example is the rapid inflow of trading funds in April to May this year, without a clear return of EPFR active foreign capital, resulting in the market becoming volatile.
On the contrary, if the restoration of the fundamentals drives more active long-term capital inflows, then the market space will also be larger. By the end of 2022, the market rebounded continuously for three months from the end of October, during which the MSCI China surged by nearly 60%. Passive foreign investment gradually flowed in from late September, while active foreign investment began to flow in after the market rose for two months, starting from early January with a 40% increase, and continued to flow in until early March, with the market peaking at the end of January.
Chart: Active foreign investment accelerating outflows from A-share and Hong Kong stock markets

Chart: Passive foreign investment transitioning to inflows into the Chinese market

Chart: Fund inflows temporarily consist of trading-oriented funds such as partially hedged funds and primarily passive funds


Chart: Passive foreign capital led the market rebound at the end of 2022, while active foreign capital exhibited a certain lag

It is evident that long-term funds have a lag, but are also more critical. The allocation ratio of major active funds globally to Chinese stocks declined from a high of 14.6% in early 2021 to 5.0% in August this year, 1 percentage point lower than passive funds. We estimate that if the current underweight becomes neutral, it could bring in nearly $40 billion, equivalent to the total outflow since March 2023.
Chart: Allocation ratio of major active funds globally to Chinese stocks dropped to 5.0% in August, 1 percentage point lower than passive funds

Q5, How to trade rebounds? In the short term, focus on undervalued state-owned enterprises and lagging sectors; if fiscal stimulus boosts pro-cyclical sectors, otherwise focus on structural opportunities.
In the short term, undervalued state-owned enterprises and previously oversold sectors remain the market's direction for rebound. On one hand, PBOC's financial innovation tools may directly benefit undervalued companies especially state-owned enterprises, we have selected relevant stocks for investors in the original report. On the other hand, lagging sectors such as internet software (-24.8% since early 2024), food retail (-16.6%), medical service equipment (-14.8%), etc., may also be the direction of emotional rebound game.
If policies continue to be fulfilled and fiscal measures exceed expectations, pro-cyclical sectors directly benefiting are expected to outperform, including consumer, real estate chain, and non-bank financials. In addition, we continue to recommend focusing on interest rate-sensitive growth stocks (internet, technology growth, biotechnology, etc.), Hong Kong stocks with local dividends and property, and export chains driven by US real estate demand.
However, if fiscal measures are insufficient or slower than expected, the market may need to digest through fluctuations. In such cases, high dividends still hold long-term allocation value, and investors can take advantage of recent pullbacks to enter at the right time, but following the order of following the economic environment along the cycle dividends, bank dividends, defensive dividends, government bonds, and cash. Secondly, certain sectors supported by policies or on the rise are still likely to be boosted by favorable factors and demonstrate greater elasticity, such as those with their own industry outlook (internet, gaming, education) or policy-supported technology growth (technology hardware and semiconductors).
Chart: Sectors such as internet software, food retail, medical service equipment have underperformed this year.

Chart: If fiscal policy strengthens to boost the cyclicals, on the contrary, focus on structural opportunities.

With continuous bullish policies, have the multiple large green candles in the A-share market changed your perspective? It may be troublesome to access A-shares in Hong Kong, but you can trade in just 3 steps on Futu>>
Related recommendations: How can Hong Kong investors trade A-shares?
Editor/Lambor
