
 现货黄金上周五收盘下跌0.53%,报2658.04美元/盎司;金价盘中最高触及2674.35美元/盎司。
#GoldTechnical Analysis#24K99 News On Monday (September 30th), in the Asian market session, spot gold suddenly plunged in the short term, with the gold price just falling to around $2,648 per ounce, nearly $18 lower than the earlier intraday high of $2,666.04 per ounce. Analyst Nicholas Kitonyi from the well-known financial website FXDailyReport wrote an article analyzing the future trend of gold.
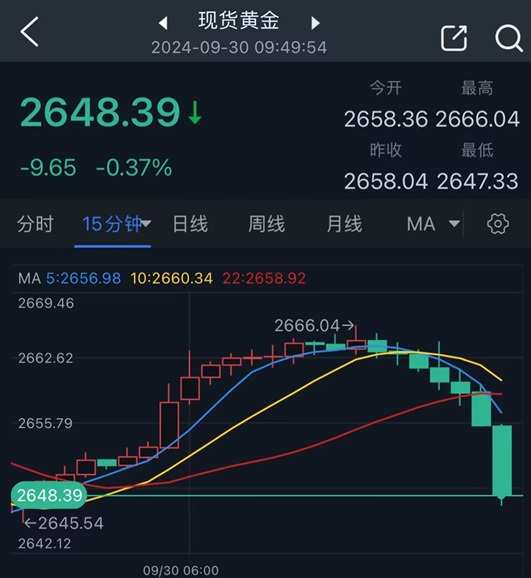
(Source: 24K99) 15-minute chart for spot gold.
Kitonyi stated that, on the 60-minute chart, the gold price has completed a downward breakthrough from the rising channel. Last Friday's pullback pushed the price slightly below the 100-hour moving average. Therefore, the gold price is on the verge of entering oversold levels for 14 hours.RSIThe edge of oversold level.
 Spot gold closed down 0.53% last Friday, at $2658.04 per ounce; the highest price touched $2674.35 per ounce during the session.
Last Thursday, the price of gold once soared to $2685.58 per ounce, reaching a historical high.
Two pictures of the technical prospects of gold
In terms of short-term trends, Kitonyi states that from technical aspectsNow, based on the 60-minute trend chart of gold, the gold price has completed a downward breakthrough from the upward channel. 14 hoursRelative Strength Index(RSI) has fallen closer to the oversold level of the indicator.
Therefore, gold bears will seek to continue the current downward trend in gold prices, falling towards $2630 per ounce, or even lower to $2607 per ounce.
On the other hand, gold bulls will look to take profit as gold rebounds to around $2676 per ounce, or even higher at $2697 per ounce.
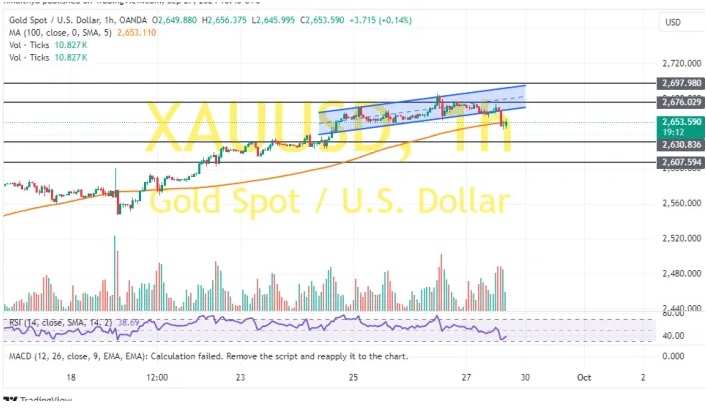
(Spot gold 60-minute chart source: FXDailyReport)
Kitonyi pointed out that on the daily chart, the price of gold is trading within an ascending channel. After entering the overbought state of this indicator, the 14-day RSI also seems to support a long-term bullish bias.
Therefore, gold bulls will set their long-term profit target at around $2748 per ounce, or even higher at $2837 per ounce.
On the other hand, bears will seek to take profit as the gold price falls back to around $2559 per ounce, or even lower to $2465 per ounce.

(Spot gold daily chart source: FXDailyReport)
At 09:49 peking time, spot gold is trading at $2648.39 per ounce.