
Symbotic Inc. (NASDAQ:SYM) shareholders are no doubt pleased to see that the share price has bounced 28% in the last month, although it is still struggling to make up recently lost ground. Unfortunately, the gains of the last month did little to right the losses of the last year with the stock still down 24% over that time.
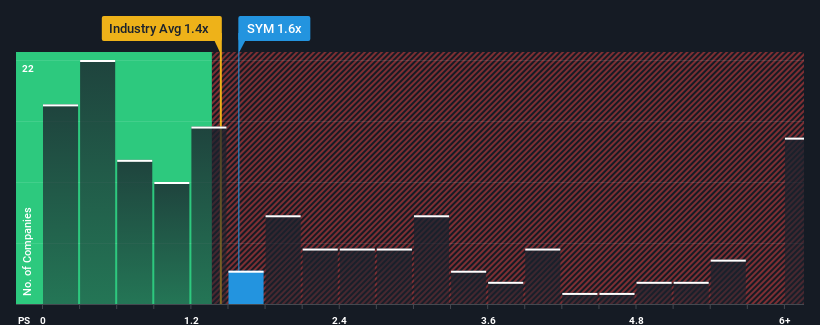
In spite of the firm bounce in price, you could still be forgiven for feeling indifferent about Symbotic's P/S ratio of 1.6x, since the median price-to-sales (or "P/S") ratio for the Machinery industry in the United States is also close to 1.4x. Although, it's not wise to simply ignore the P/S without explanation as investors may be disregarding a distinct opportunity or a costly mistake.
What Does Symbotic's Recent Performance Look Like?
Symbotic certainly has been doing a good job lately as it's been growing revenue more than most other companies. Perhaps the market is expecting this level of performance to taper off, keeping the P/S from soaring. If you like the company, you'd be hoping this isn't the case so that you could potentially pick up some stock while it's not quite in favour.
Keen to find out how analysts think Symbotic's future stacks up against the industry? In that case, our free report is a great place to start.How Is Symbotic's Revenue Growth Trending?
 Symbotic's P/S ratio would be typical for a company that's only expected to deliver moderate growth, and importantly, perform in line with the industry.
If we review the last year of revenue growth, the company posted a terrific increase of 62%. The latest three year period has also seen an incredible overall rise in revenue, aided by its incredible short-term performance. Accordingly, shareholders would have been over the moon with those medium-term rates of revenue growth.
Shifting to the future, estimates from the analysts covering the company suggest revenue should grow by 31% per annum over the next three years. That's shaping up to be materially higher than the 5.1% per annum growth forecast for the broader industry.
With this in consideration, we find it intriguing that Symbotic's P/S is closely matching its industry peers. It may be that most investors aren't convinced the company can achieve future growth expectations.
The Bottom Line On Symbotic's P/S
Symbotic appears to be back in favour with a solid price jump bringing its P/S back in line with other companies in the industry We'd say the price-to-sales ratio's power isn't primarily as a valuation instrument but rather to gauge current investor sentiment and future expectations.
We've established that Symbotic currently trades on a lower than expected P/S since its forecasted revenue growth is higher than the wider industry. When we see a strong revenue outlook, with growth outpacing the industry, we can only assume potential uncertainty around these figures are what might be placing slight pressure on the P/S ratio. This uncertainty seems to be reflected in the share price which, while stable, could be higher given the revenue forecasts.
It is also worth noting that we have found 2 warning signs for Symbotic that you need to take into consideration.
It's important to make sure you look for a great company, not just the first idea you come across. So if growing profitability aligns with your idea of a great company, take a peek at this free list of interesting companies with strong recent earnings growth (and a low P/E).
Have feedback on this article? Concerned about the content? Get in touch with us directly. Alternatively, email editorial-team (at) simplywallst.com.
This article by Simply Wall St is general in nature. We provide commentary based on historical data and analyst forecasts only using an unbiased methodology and our articles are not intended to be financial advice. It does not constitute a recommendation to buy or sell any stock, and does not take account of your objectives, or your financial situation. We aim to bring you long-term focused analysis driven by fundamental data. Note that our analysis may not factor in the latest price-sensitive company announcements or qualitative material. Simply Wall St has no position in any stocks mentioned.
